🧭 Zero Trust Model
Zero Trust approach assumes that no device or user—inside or outside your network—should be trusted by default. It relies on three core principles:
1 – Verify explicitly
Always authenticate and authorize based on all available data, such as user identity, location, device health, service, and more.
2 – Use Least Privilege Access
Grant only the minimum access users or services need to perform their tasks—nothing more.
3 – Assume breach
Design your systems assuming that a breach has already occurred. Limit blast radius and segment access to reduce impact.
🛠 Tools Commonly Used in Zero Trust
1 – Azure AD
For identity and access management (IAM), including user authentication and SSO.
2 – Microsoft Sentinel
A SIEM (Security Information and Event Management) solution for monitoring and analyzing security logs.
3 – Microsoft Defender
Provides protection for Microsoft 365 services and endpoints (e.g., detects phishing, malware, suspicious logins).
4 – Microsoft Intune
Manages and secures devices, enforces compliance policies, and integrates with conditional access.
☁️Cloud Adoption Framework
The Cloud Adoption Framework is a Microsoft methodology for guiding cloud transformation in a structured and secure way. It includes five stages:
1 – Ready
Prepare your cloud environment (networking, identity, governance setup).
2 – Adopt
Migrate and modernize your workloads.
3 – Secure
Implement security controls like Zero Trust, threat protection, and compliance.
4 – Manage
Monitor performance, cost, and compliance using tools like Azure Monitor.
5 – Govern
Set policies and standards for resource usage, access, and cost management.
🌐Basic Network Concepts
1 – On-Premises Network
Traditional network setup in your local data center or office building.
2 – Hub Network (in Azure)
A central virtual network (VNet) used for shared services like firewalls, DNS, or VPN gateways.
3 – Spoke Network
VNets connected to the hub; typically used for isolated workloads or apps.
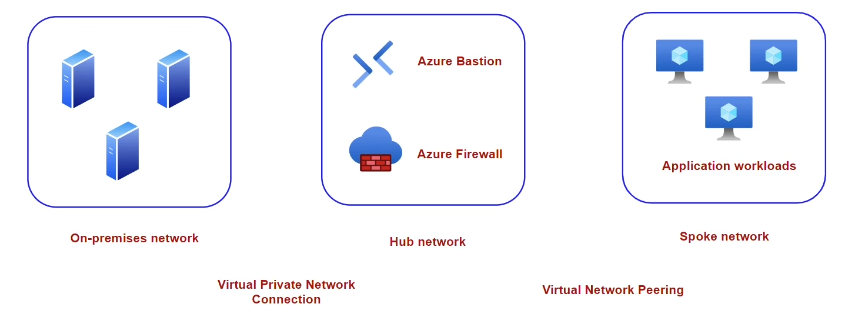
🌉 Connecting On-Premises to Azure
To connect your on-premises network to the Azure hub network, you can use:
- VPN Gateway (for internet-based secure connection)
- ExpressRoute (for private dedicated connectivity)
➡️ Traffic from on-premises first enters the hub network, which then routes it to the appropriate spoke network or resource.
Section Summary
🛡️ What is Microsoft Sentinel?
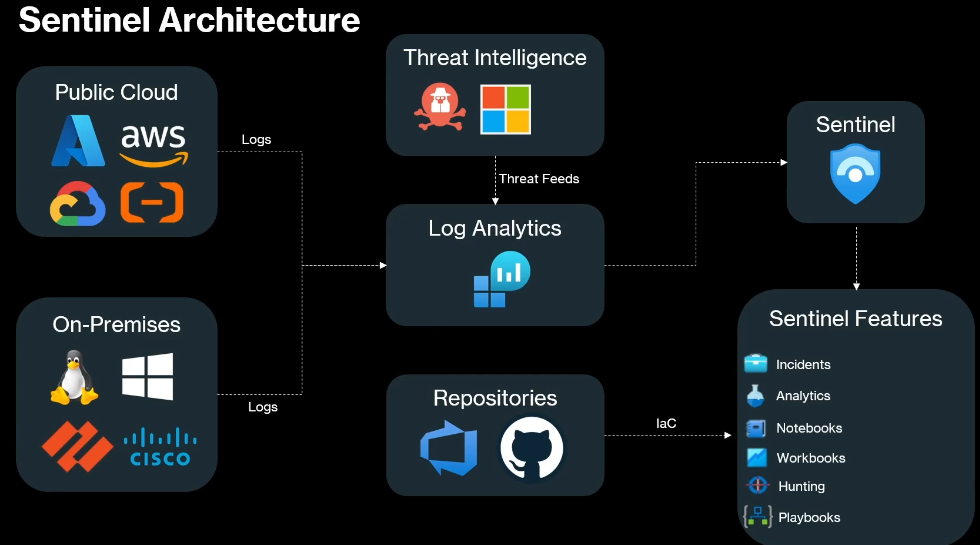
Microsoft Sentinel is a cloud-native SIEM (Security Information and Event Management) and SOAR (Security Orchestration Automated Response) solution from Azure. It helps detect, investigate, and respond to threats across your environment.
- SIEM is for analyzing and managing security-related events.
- SOAR helps automate incident response—like isolating a device or disabling a user.
Sentinel sits on top of Log Analytics Workspace (LAW) and analyzes the data sent to it. It also works closely with Azure Monitor, which logs all resource activity.
🛠️ Setting Up Microsoft Sentinel
- Create a Log Analytics Workspace (LAW)
This is the foundation for Sentinel. Logs from different sources are sent here for analysis. Each tenant needs its own LAW, and some organizations may restrict cross-region data flow. - Deploy Microsoft Sentinel
Link Sentinel to the LAW you’ve created. - Connect Data Sources via Content Hub
Sentinel receives data through ExpressRoute, VPN, or HTTPS (REST APIs).
Content Hub provides not just connectors but also:- Analytics rules
- Dashboards
- Workbooks
- Prebuilt queries
💡 Ingesting Threat Intelligence
You can simulate threat intelligence ingestion using sources like Pulsedive by installing the relevant content solution from the Content Hub.
🔑 Ingesting Entra ID Logs
To monitor Entra ID (formerly Azure AD):
- Go to Data Connectors → Entra ID
- Choose the log types (e.g., sign-ins, audit logs)
- Run sample queries to verify the logs are flowing into Sentinel
🖥️ Ingesting VM Logs Using AMA & DCR
To collect Windows Security Event Logs from VMs:
- Install the Windows Security Events Solution from the Content Hub.
- Go to the connector page and create a Data Collection Rule (DCR).
- The DCR defines:
- Which VMs to collect from
- What types of logs to collect (e.g., SecurityEvents)
- Once configured, check Sentinel > Logs > SecurityEvent table to confirm data is flowing.
This modern approach replaces the older manual method of using Event Viewer on each server.
🌐 NSG Flow Logs
To monitor network traffic in and out of VMs:
- Create a Storage Account to store flow logs.
- Create and configure Network Watcher.
- Enable NSG Flow Logs for VM’s network interface.
Flow logs are stored in JSON format and updated every minute. They provide deep visibility into network activity. The logs are saved in subfolders inside the storage account container.
🛡️ Microsoft Sentinel = SIEM + SOAR
Microsoft sentinel is resource in Azure, that works on top of another resource Log Analytics workspace, analyzing data sent to Log Analytics workspace and looking for any threats.
Azure Monitor also utilize logs sent by Log Analytics Workspace.
In Azure monitor, we have Activity log, which login any activities done on resource in an Azure subscription.
Microsoft sentinel, is Azure service that provides SEIM and SOAR.
When a security incident happens, SOAR(Security Orchestration Automated Response) kicks in. SOAR responds to the incident automatically—like isolating a device or disabling an account..
Afterward, security engineers use SEIM (Security Information Event Management) to analyze why this happened.
🛠️ Microsoft Sentinel : Setup
1 – Setup Log Analytics Workspace
We can send data to LAW from any region, but have to consider data transfer cost.
Sometimes based on organizational requirements Log Analytics workspace cannot cross boundaries.
Also each tenant need its own Log Analytics Workspace.
Some organizations may restrict cross-boundary data flow.
2 – Create Microsoft Sentinel
Add, Log Analytics Workspace resource we created.
3 – Data Connectors / Content Hub (New)
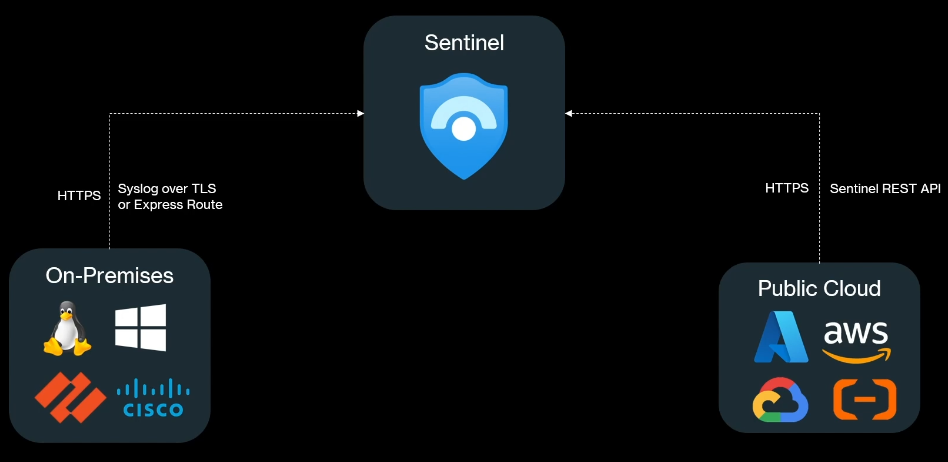
Sentinel can receive data through: Express route, VPN, HTTPS(REST-API)
📌 Note: Data Connectors has been moved to Content Hub
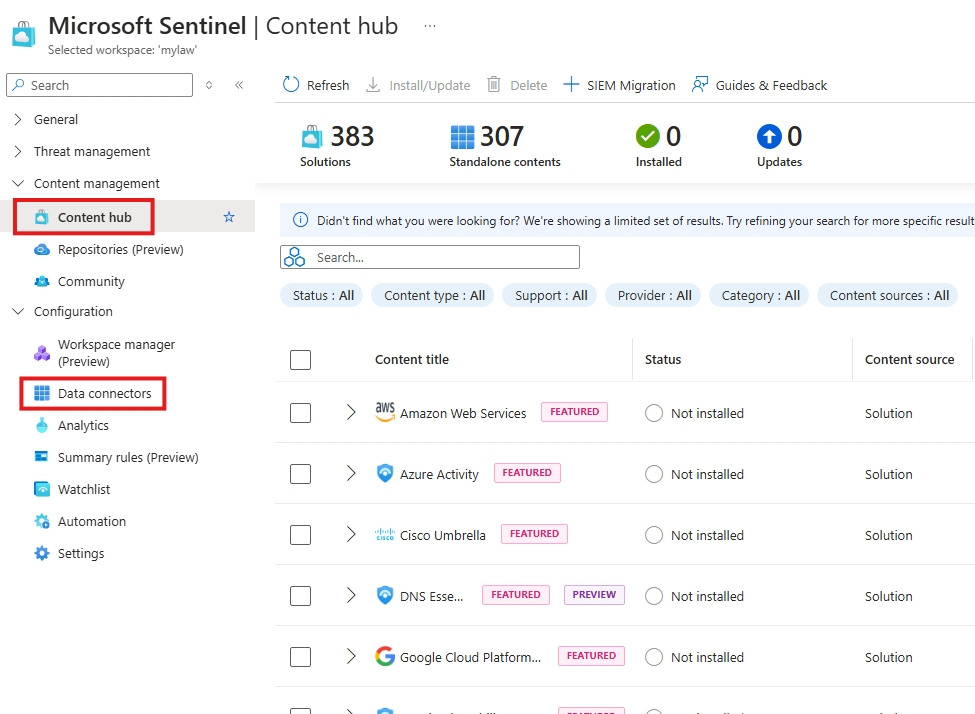
In content hub we get more than connectors; We get full solutions.
Includes everything needed for that data type:
- Analytics rules
- Data connectors
- Prebuilt queries
- Dashboards
For a content type : Azure activity
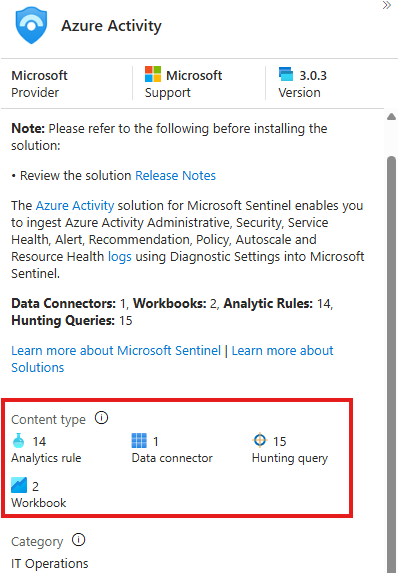
We get Analytics rule, connectors, hunting query, workbook
Ingesting Threat Intelligence
We will be ingesting test threat intelligence data from pulse dive.
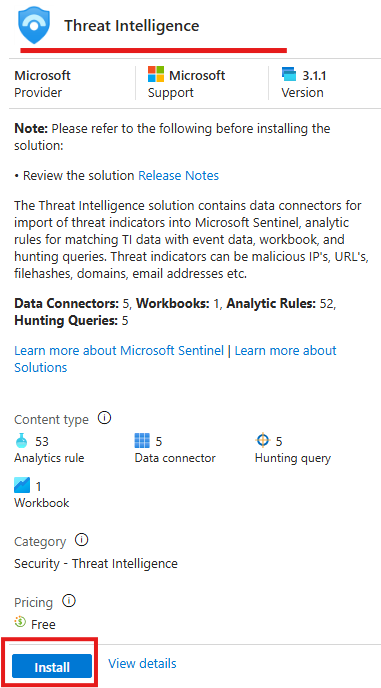
Install the appropriate threat intelligence content pack(content solution) from the Content Hub.
Ingesting Entra ID
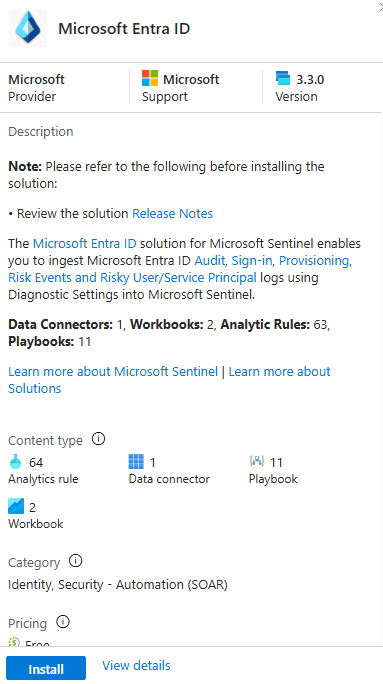
After installation goto: Data Connectors > Connector page
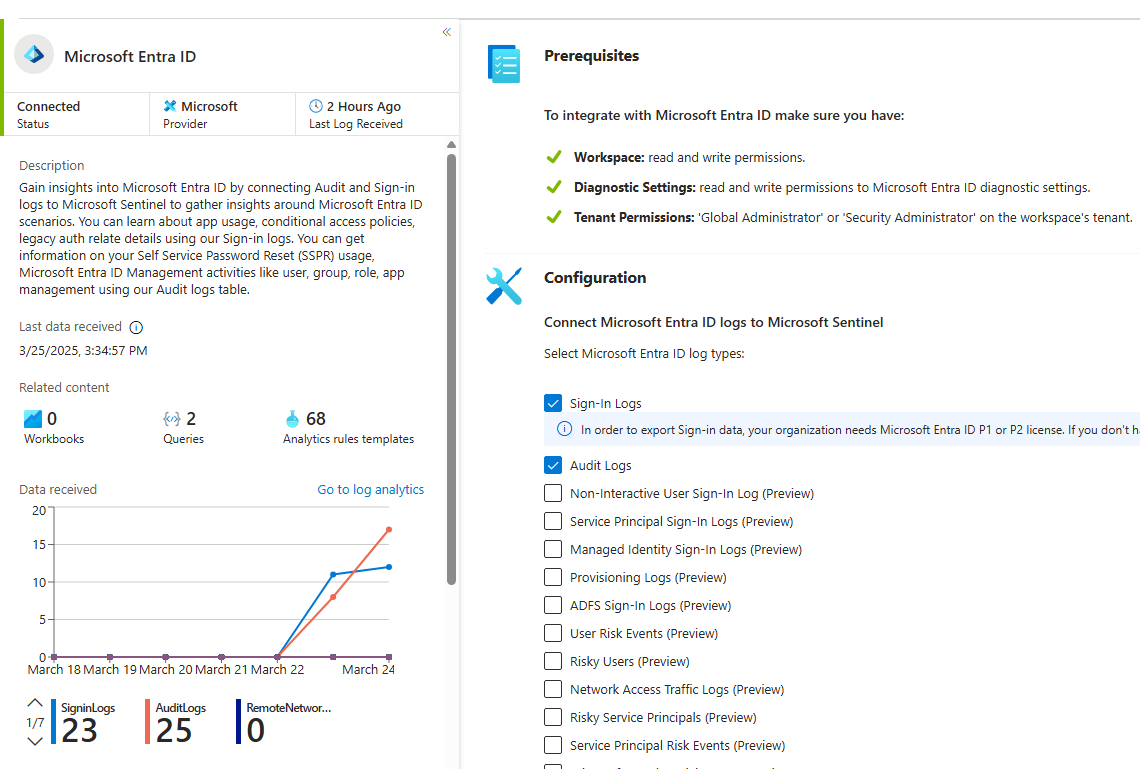
Here we can select different Entra Id related logs
To verify Entra ID Connection:
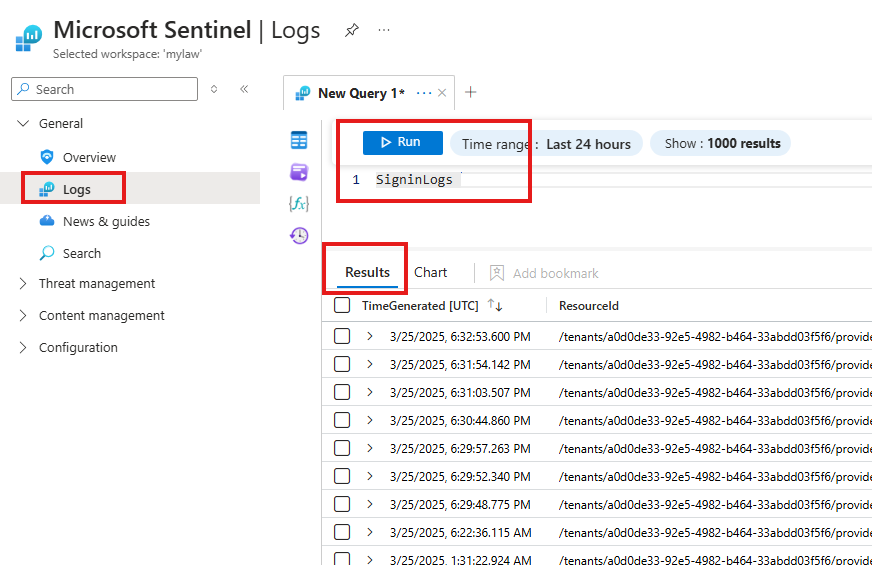
We can query the tables to verify the connection.
🖥️ Ingesting VM Data: Windows Security Event Logs, with AMA and DCR
To collect security logs from Windows VMs in Azure, we use:
- AMA: Azure Monitor Agent
- DCR: Data Collection Rule
This approach ensures that logs are ingested into the Log Analytics Workspace (LAW) connected to Microsoft Sentinel.
📥 Step-by-Step Setup
1 – Install the Windows Security Events Content Pack
From Azure portal: Sentinel > Content Hub > (Install) Windows Security Events
2 – Open the Data Connector Page
After installation
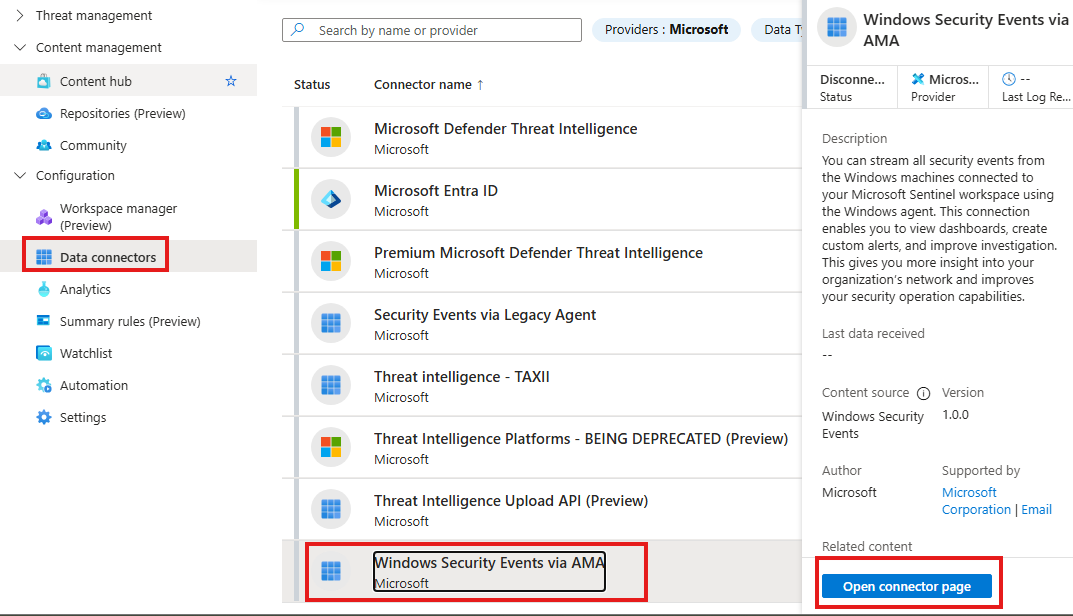
Data connector > Open Connector page
3 – Create a Data Collection Rule (DCR)
Now, we need to create a data collection rule.
This rule tells Sentinel which logs to collect and from where.
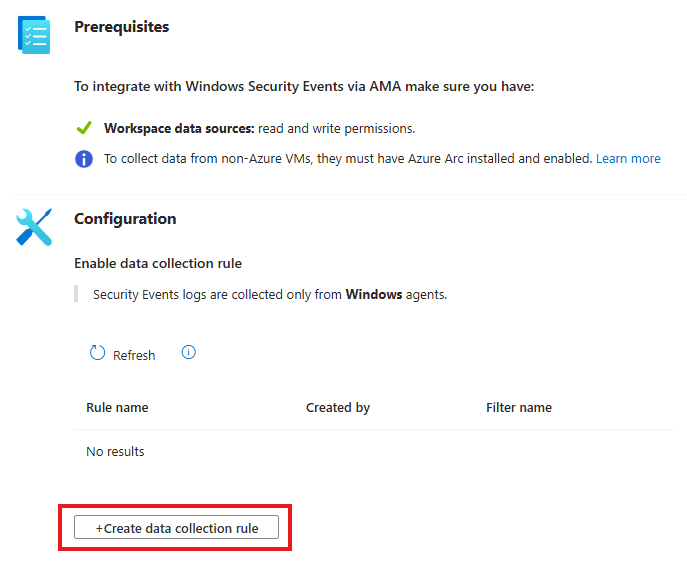
While creating the rule, you can specify:
Options: All logs, Custom logs, etc.
Which VMs to collect logs from
What type of logs to collect
✅ Verifying the Connection
Once the DCR is in place and data starts flowing, you can:
- Go to:
Sentinel > Logs - Look for the new table:
SecurityEvent
If you see data appearing in this table, your VM logs are successfully connected.
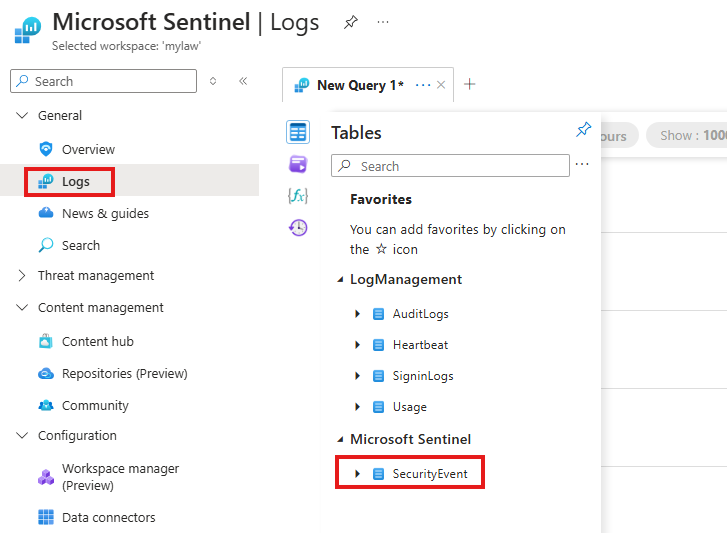
Check Logs in Sentinel, here we will see newly added table : SecurityEvent
Legacy way to monitor logs in server
Legacy way is log into each server to Event Viewer to look at the logs.
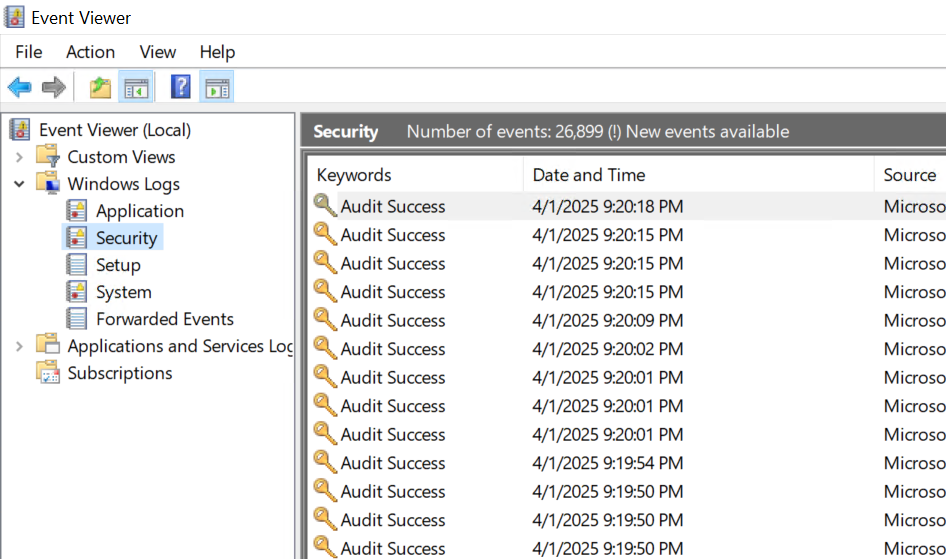
These are the logs that is getting injected in to Log Analytics Workspace used by Sentinel from all VMs.
NSG Flow logs
For a VM in Azure, there will be Network interface and NSG(Network Security Group). All the traffic in and out of VM has to go through NSG.
We can enable NSG Flow logs. They are in JSON format and collected in 1 min interval.
1 – Create Storage account Azure resource if not already
To enable NSG flow logs, we need to create Storage account to store the logs.
2 – Create a Resource called Network Watcher
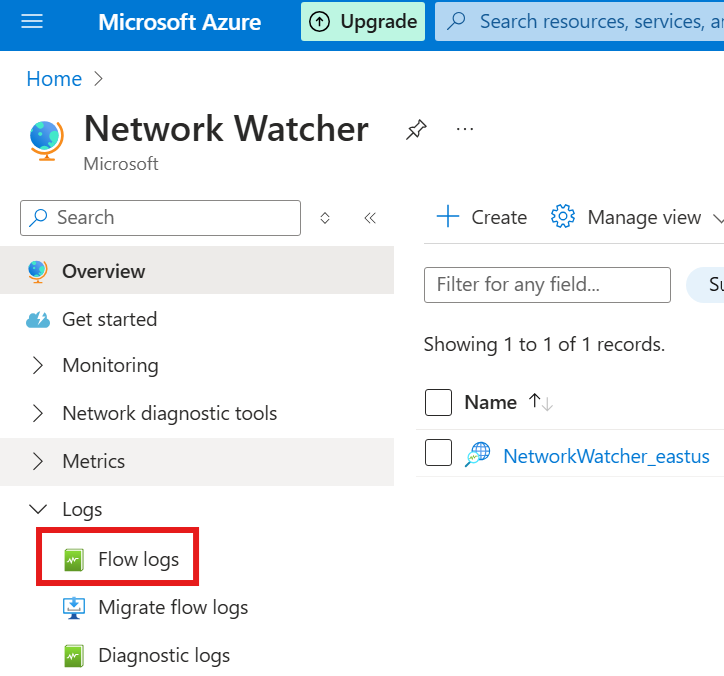
Create new Flow logs.
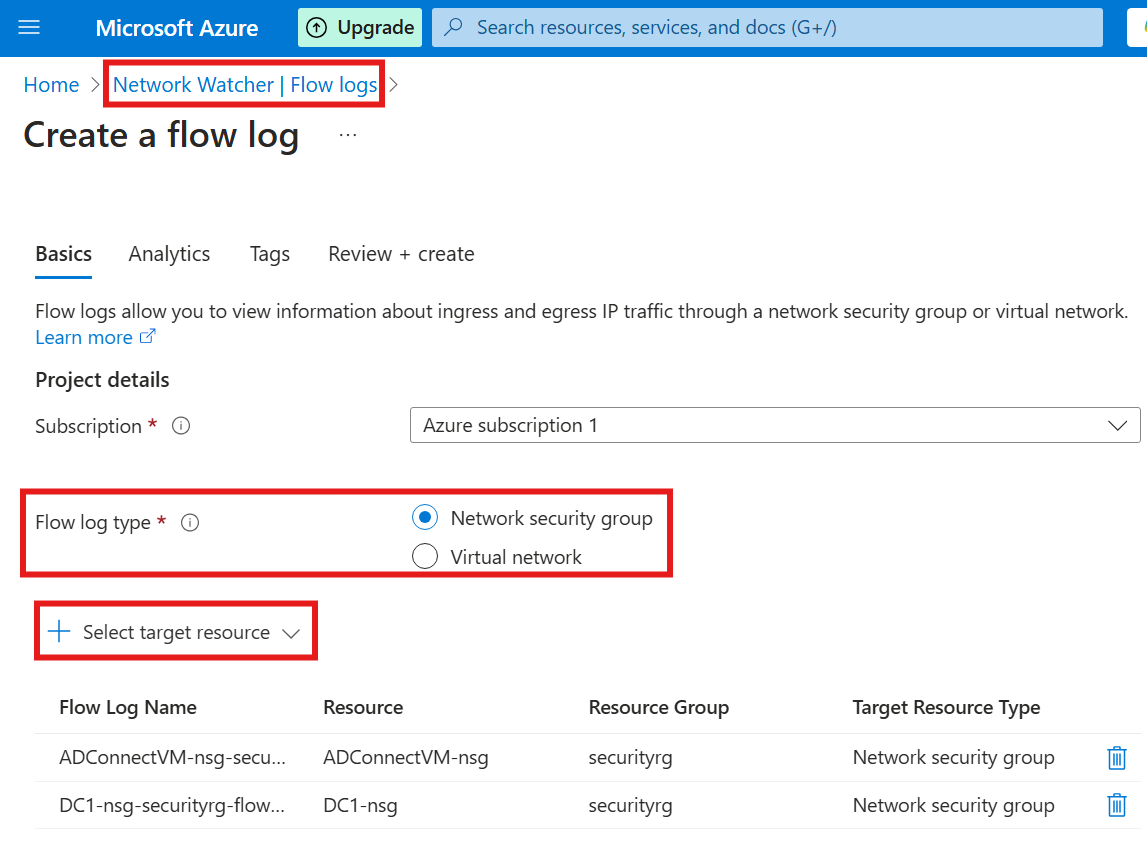
Select Flow log type as NSG, and select the VMs to get the logs.
After some time VM logs will be created in the Storage account > container.
There will be multiple levels of sub folders.
To know the details of various JSON keys used in the flow log, please refer: NSG flow logs overview – Azure Network Watcher | Microsoft Learn
Section Summary
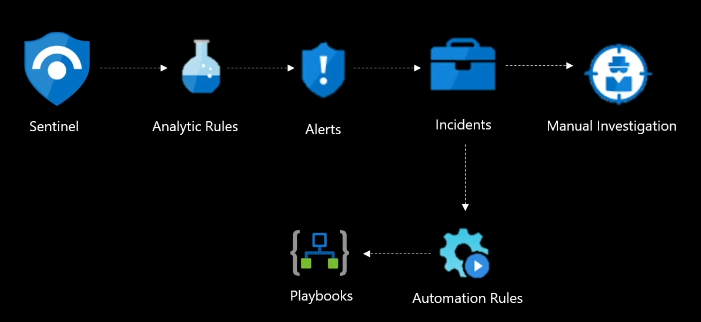
🔍 What Are Analytics Rules?
Analytics rules in Microsoft Sentinel help detect suspicious activity by scanning logs and generating alerts. These alerts can be grouped into incidents, which represent potential security threats.
🧠 Types of Analytics Rules
Sentinel offers different types of rules based on how and when they run:
- Scheduled: Runs on a regular schedule (e.g., every 5 minutes).
- Near Real-Time (NRT): Runs every minute for fast detection.
- Fusion: Detects complex multi-step attacks across different services.
- ML Behavior: Uses machine learning to spot unusual behavior.
- Threat Intelligence: Matches your logs with known threat indicators.
- Microsoft Security: Forwards alerts from Microsoft security tools (like Defender).
⚙️ How to Create a Rule
You can create rules from the Analytics section in Sentinel. You choose:
- What type of activity to detect (using simple queries)
- When to run the rule
- What to do when the rule finds something (create alert, incident, etc.)
🚨 What Are Incidents?
When alerts are triggered, Sentinel can group them into incidents. An incident gives a bigger picture of what’s happening, so security teams can investigate easily.
From the Incidents section, you can:
- See details of the alert
- Check related logs
- Assign tasks or users to investigate
⏱️ What Is Ingestion Delay?
Sometimes there’s a delay between when an activity happens and when it shows up in Sentinel. This is called ingestion delay.
To handle this:
- Make sure rules run more frequently than the time data might take to arrive
- Use built-in tools to check for delays and adjust your rules accordingly
🧩 Key Concepts
- Events: Anything that happens (log entries, system activity)
- Alerts: Interesting or suspicious events
- Incidents: Grouped alerts that represent a potential security threat
📊 Analytics Rules = Your SIEM Use Cases
Analytic Rules are your SIEM use-cases
Sentinel comes with over 500 rule templates
Limit of 512 rules per workspace
Types of analytic rules:
- Scheduled
- Near-Real-Time (NRT)
- Fusion
- ML Behavior Analytics
- Threat Intelligence
- Microsoft Security
- Anomaly
| Rule Type | Description |
|---|---|
| Scheduled | Runs on a fixed schedule using KQL queries |
| Near-Real-Time (NRT) | Runs every 1 minute for immediate detection |
| Fusion | Uses advanced detection for multi-stage attacks |
| ML Behavior Analytics | Learns behavior over time to detect anomalies |
| Threat Intelligence | Matches logs with threat intel indicators |
| Microsoft Security | Forwards alerts from Microsoft security services |
| Anomaly | Detects abnormal patterns |
⚙️ Creating Analytics Rules
To create an Analytics Rule, Go to : Sentinel > Analytics(Configuration)
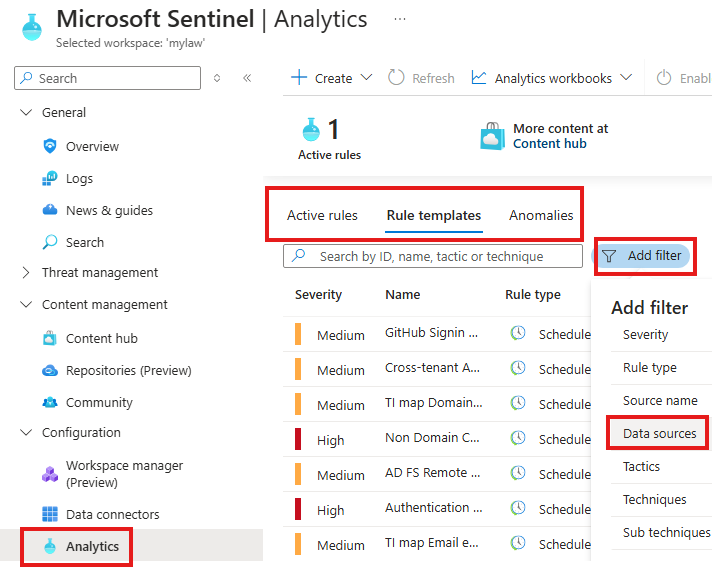
Here there are some templates provided by Microsoft.
We can filter based on Data sources.
⏰ Analytics Rule: Scheduled
Scheduled Analytic Rules : Checking for users in Entra
These are rules that run continuously on a time frame, like every hour etc.
To create an Scheduled Analytics Rule, Go to : Sentinel > Analytics(Configuration) > Create Scheduled rule
Here we are scheduling a rule that will run every 5 mins, to check if any new user has been added.
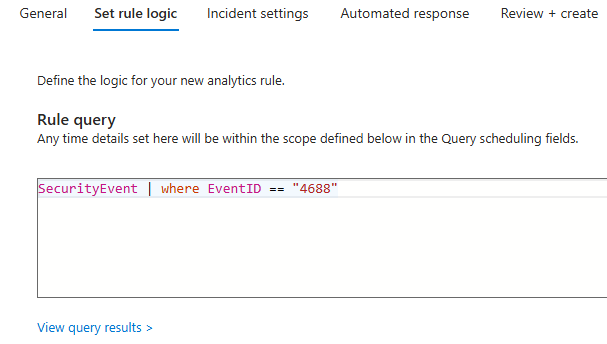
On the set rule logic tab, we can give KQL query
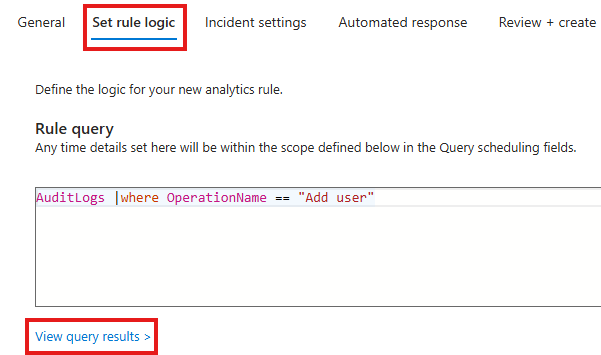
We can also view query result, before proceeding.
Alert from Scheduled Analytics Rule
We can also schedule the rule to run.
For a Scheduled analytics rule to generate an alert, we have to give a Alert threshold.
To counter ingestion delay, scheduled time period for a rule should be less that look back period of the data.
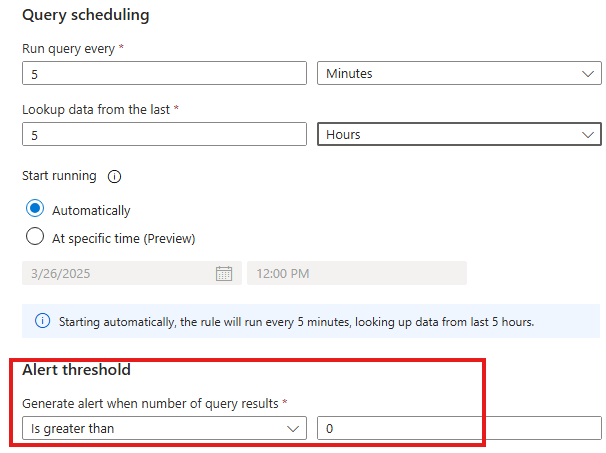
Here, alert will be generated if just 1 new user is added.
From Incident settings tab, we can enable if any incident need to be generated for the alert.
From Automated response tab, we configure SOAR (not doing that now).
Scheduled Analytic Rules : Checking for new processes in Windows VM
While creating the Scheduled analytics rule, for MITRE ATT&CK, select:
Persistence > Create or Modify system processes
KQL query should query the correct table, SystemEvent table and look for EventId of 4688. This is event id for adding new process.
In the Incident settings tab, we can
1 – Group alerts
2 – Create Incidents from alert
View the incident created from the query alerts
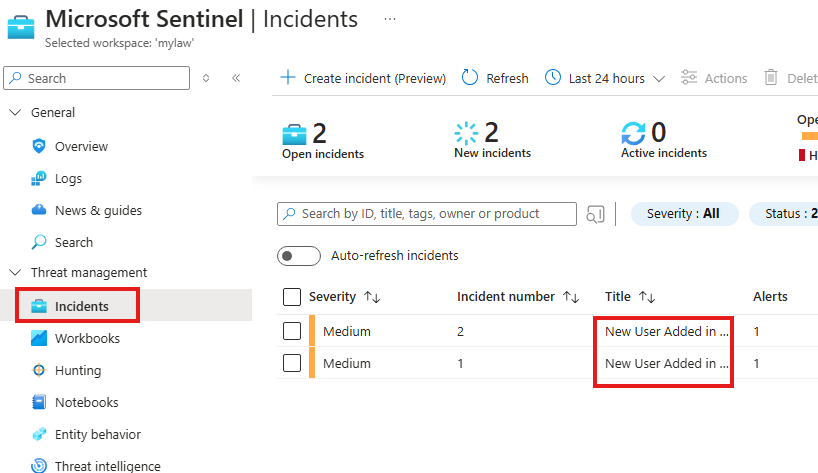
After some time, Go to the Incidents blade.
⚡Analytics Rule: Near-Real-Time (NRT)
Run every 1 min.
Sentinel > Analytics(Configuration) > Create NRT Rule
🔁 Analytics Rule: Fusion
Analytic Rule that is an advanced multistage attack detection feature including over 120 detections across multiple Microsoft data sources:
- Entra ID Identity Protection
- Defender for Cloud
- Defender for loT
- M365 Defender
To create a Fusion Analytics rule, we have to look for 1 and only rule type Fusion template, named : Advanced Multi-stage Attack Detection
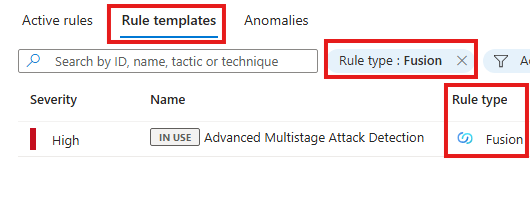
We can only have 1 Fusion rule per workspace; If it is already created, we can edit it by:
Right Click > Edit > Configure fusion
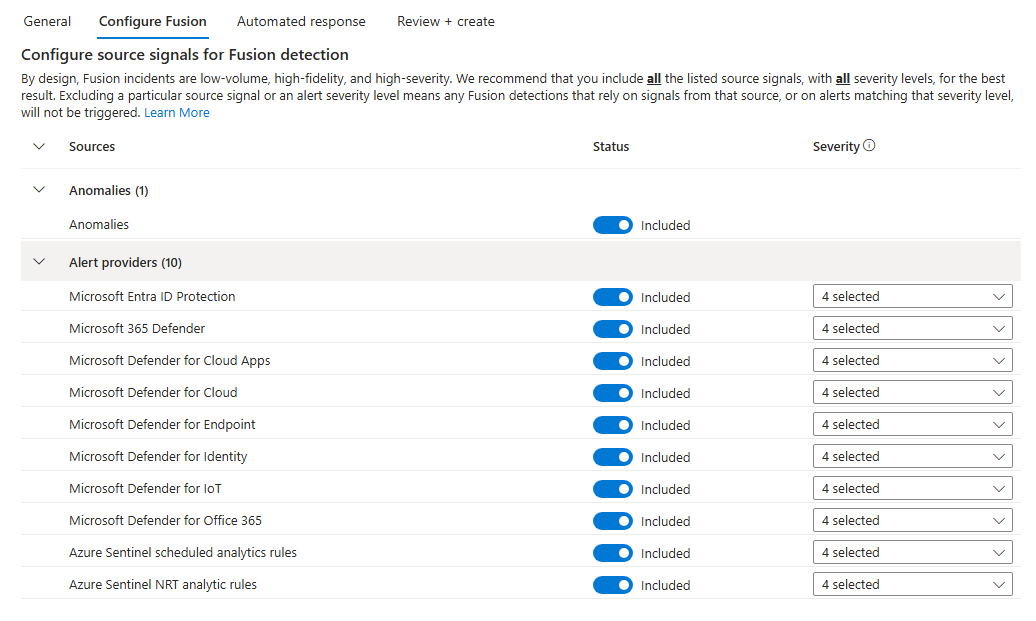
Here, we can configure data sources.
🧠 Analytics Rule: ML Behavior
This rule monitors unusual Windows RDP and Linux SSH.
Based on IP, location, user etc.
To create a new rule, we need to search in rule templates, with filter for rule type of ML Behavior.
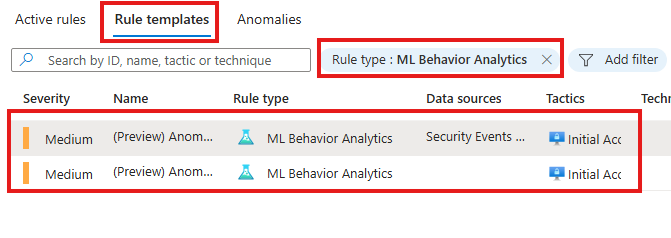
There will be only 2 ML Behavior rule templates: for Windows RDP and Linux SSH.
After activation, rule need at least 7 days to learn the normal behavior, to detect unusual behavior.
🛡️ Analytics Rule: Threat Intelligence Rules
Generates an alert when a Microsoft Defender Threat Intelligence Indicator gets matched with your event logs.
❌ Cannot be used with any opensource Threat intelligence like; Pulsedive
To create a new rule, we need to search in rule templates, with filter for rule type of Threat Intelligence
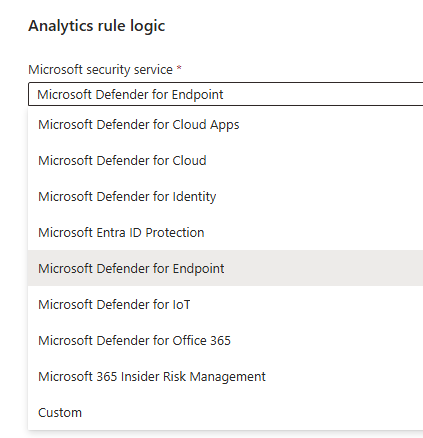
🔐 Analytics Rule: Microsoft Security Rules
Analytic rules that are alert forwarders from other Microsoft security services, such as:
– Defender for Endpoint
– Defender for Identity
– Defender for Cloud
This rule can be created from the create button:
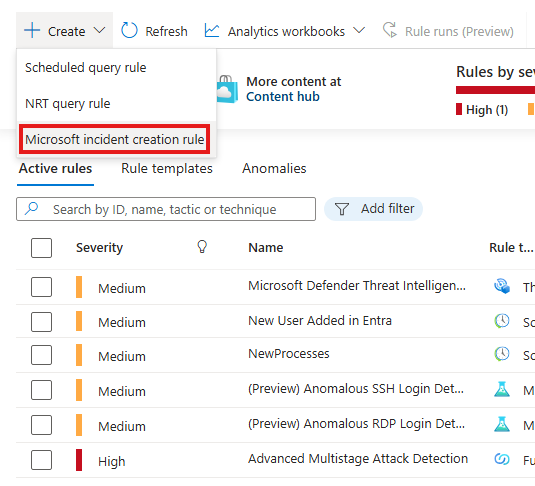
We should select from which service the alert should be forwarded.
📌 Incident Dashboard
Go to : Sentinel > Incidents (Threat Management)
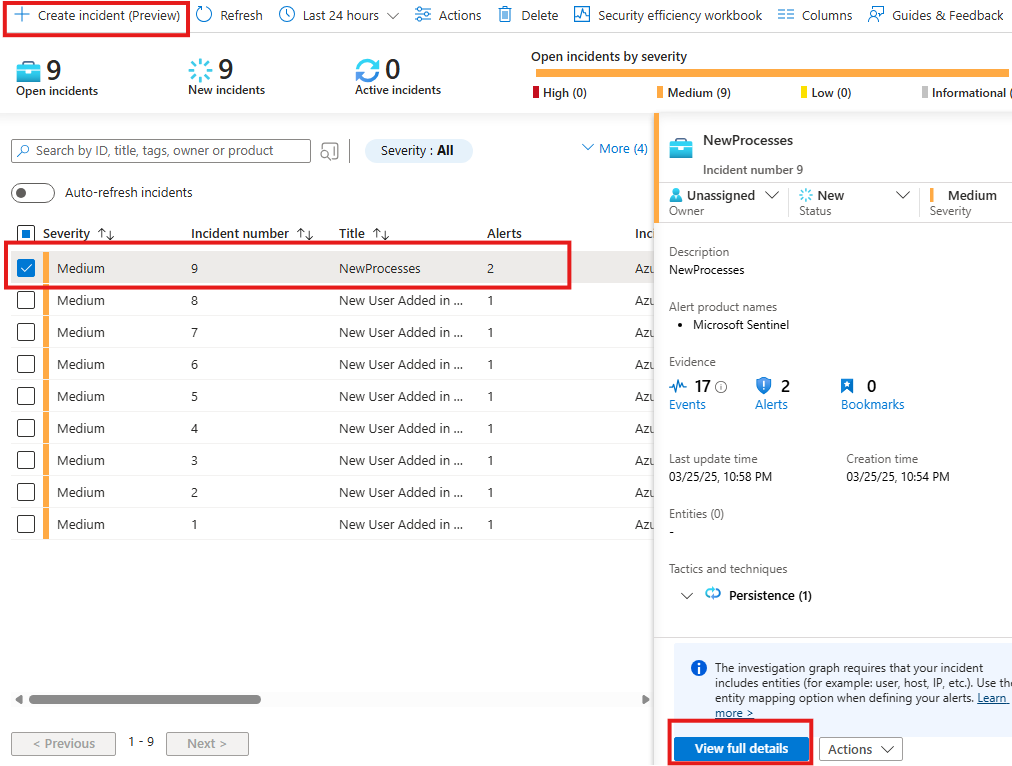
Here we can see all the incident created by our analytics rules and also we can create our own incidents.
Click on View Full details to know more.
Here we can:
- View incidents
- Analyze associated logs
- Create tasks
- Add teams
- See full incident details
🕑 Ingestion Delay
Ingestion Delay is the time between log creation at the source and ingestion into Sentinel
Ingestion Delay can significantly mess with your scheduled analytic rules
Important: Scheduled Rules consider the timestamp of the data source not the timestamp of ingest
To counter ingestion delay, scheduled time period for a rule should be less that look back period of the data.
Find the Ingestion Delay
From content hub, install a content called Workspace usage report
When this content is installed, included workbook will also get installed.
Now go to workbook to view the installed template.
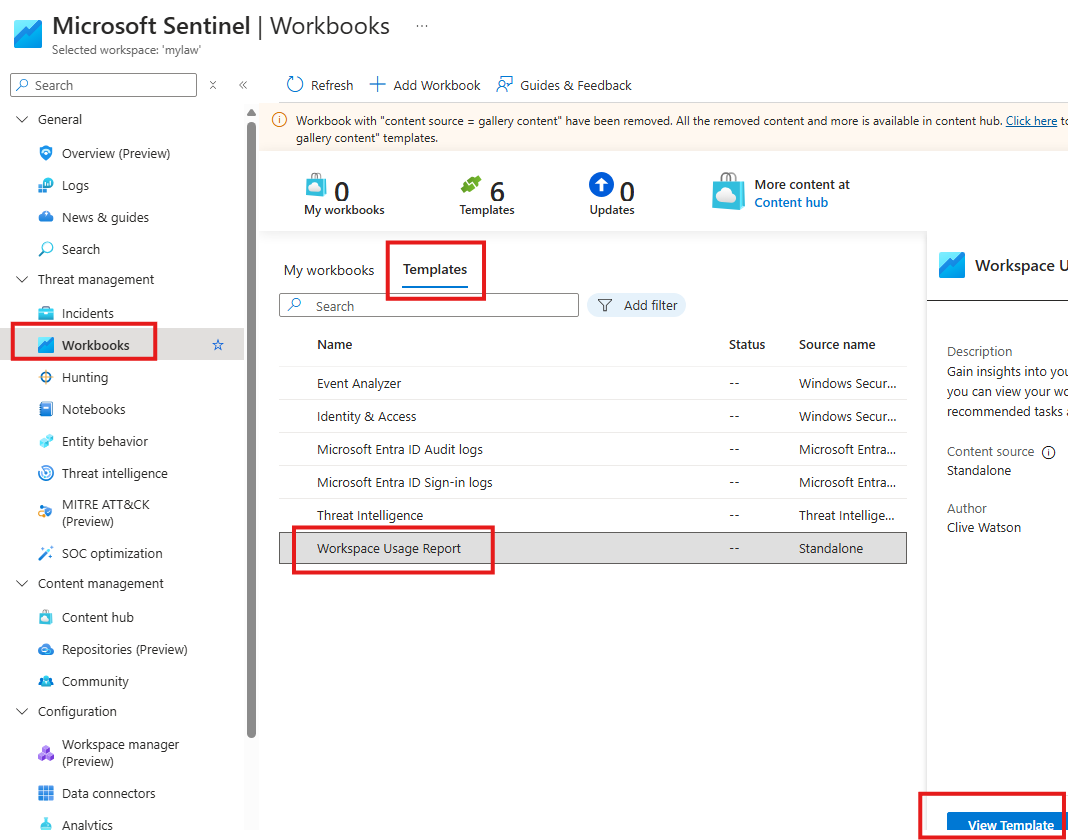
In this template we can see details like: Tables from the data is injected, latency etc.
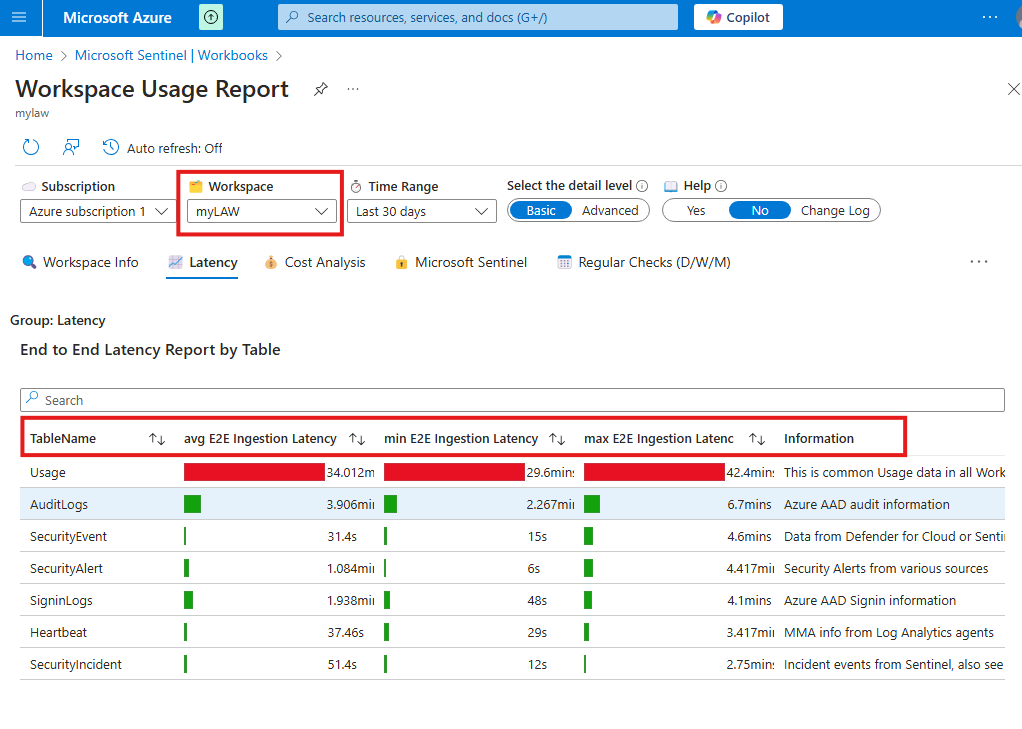
We have to select the Log Analytics Workspace first.
Section Summary
🔍 What Is Threat Hunting?
Threat hunting is the proactive search for hidden threats in your environment—before they cause harm. Instead of relying only on automatic alerts, security teams manually look for suspicious behavior using their knowledge and queries.
There are two main types of threat hunting:
- Intelligence-based hunting: Searches using known indicators like IP addresses, file hashes, or domain names.
- Hypothesis-based hunting: Starts with a theory based on attack techniques or behaviors (e.g., unusual login patterns).
🧪 Writing Threat Hunting Queries with KQL
Microsoft Sentinel uses KQL (Kusto Query Language) to write threat hunting queries.
Steps to write a KQL query:
- Start with a hypothesis – What are you trying to detect?
- Find the right table – Example:
SecurityEventfor VM logs. - Explore table structure – Understand available fields/columns.
- Filter the data – Use commands like
where,project, ortake. - Visualize results – Show charts using
render(pie chart, time chart, etc.).
🛡️ Using Sentinel’s Hunting Blade
In Microsoft Sentinel > Hunting, you’ll find:
- Predefined queries (from installed content packs)
- Option to create your own hunting scenarios
- Organize queries by tactics like Persistence, Evasion, etc.
You can:
- Add your own KQL queries
- Use existing queries
- Group related queries into a hunting session
After running a hunt, update your hypothesis (e.g., “Valid” if a threat was found), then choose to take action—like creating an incident for follow-up.
⚙️ Hunting Example: Entra ID Events
You can create a hunt to find suspicious user account activity, like:
- Detecting new accounts that weren’t authorized
- Checking logs for login attempts from unfamiliar IPs
After testing queries (e.g., create/delete a user), you can validate your findings and track them through Sentinel.
What is Threat Hunting?
Proactively searching for cyber threats that are lurking undetected in your environment
Instead of only relying on your Analytic rules in Sentinel you additionally hunt for threats via KQL
Two Threat Hunting Models:
Intelligence-based Hunting : Utilizes loCs, hash values, IP addresses, domain names or host artifacts
Hypothesis-based Hunting: Hunts are done based on IOAs and TTPs of adversaries
KQL
KQL Query Development Process
1 – Hypothesis : What you want to prove or disprove. Is an IoC part of the logs.
2 – Determine required tables
3 – Explore table schema, what all columns/fields are available in the table.
4 – Filter: Filter rows with where, project, take, etc.
5 – Visualize : Use render piechart, timechart, etc.
KQL Examples
We write KQL queries in Sentinel > Logs blade
SecurityEvent
| where EventID == "4699"
| where TimeGenerated > ago(1h)
SecurityEvent is table for events from VMs, looking for event that happened in last 1 hour.
SecurityEvent
| where EventID == "4699"
| where TimeGenerated > ago(1h)
| take 5
take or limit is keywords for getting only some counts of results;
count keyword will give the count
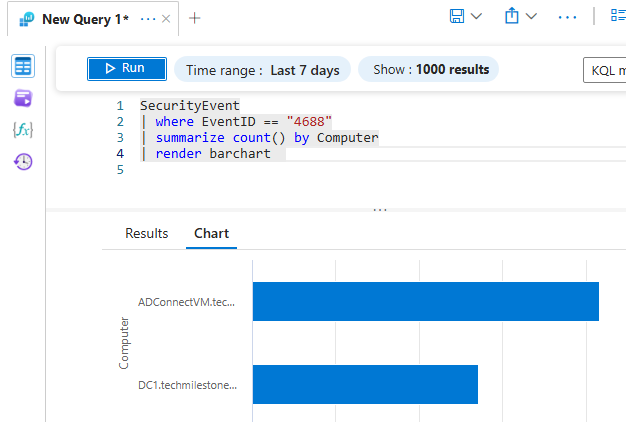
SecurityEvent
| where EventID == "4699"
| where TimeGenerated > ago(1h)
| count
summarize count
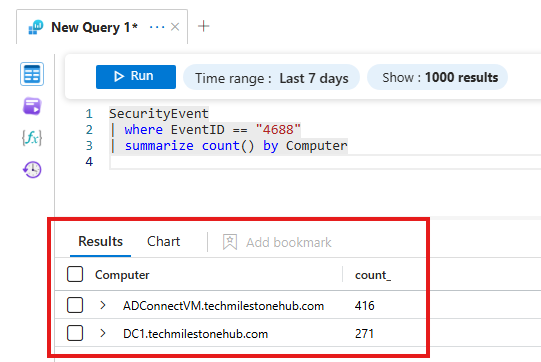
Here we will see count for the Event 4688 summarized for each VM.
render piechart
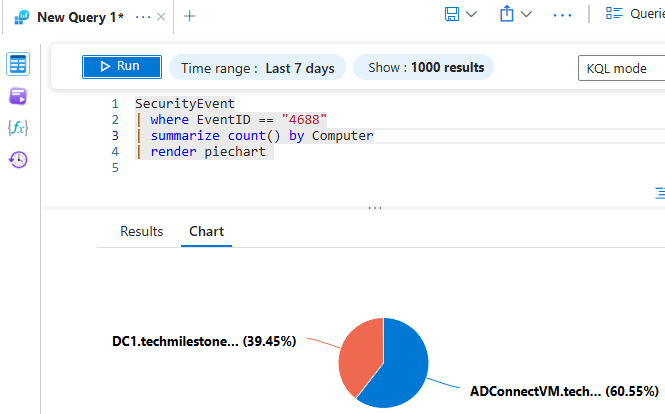
just add | render piechart to the summarized result
we can render charts like: timechart, barchart
use keyword project to selectively display columns
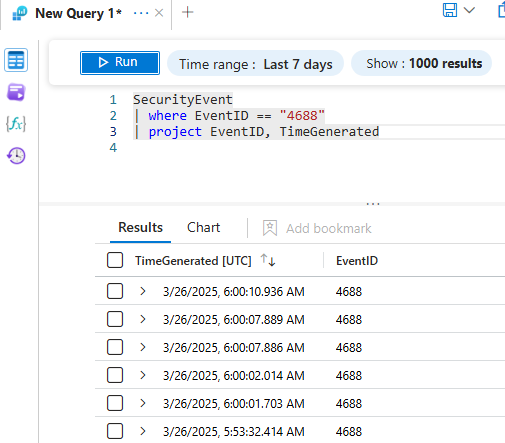
to exclude any columns use keyword: project-away
use distinct keyword to see only distinct values of a column
SecurityEvent
| distinct EventID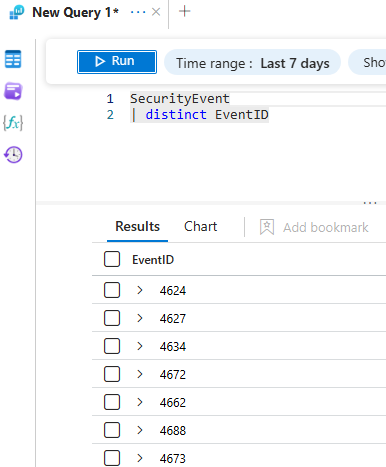
This will show all available event ids
order by keyword to sort the result
SecurityEvent
| where EventID == "4688"
| order by TimeGenerated asc 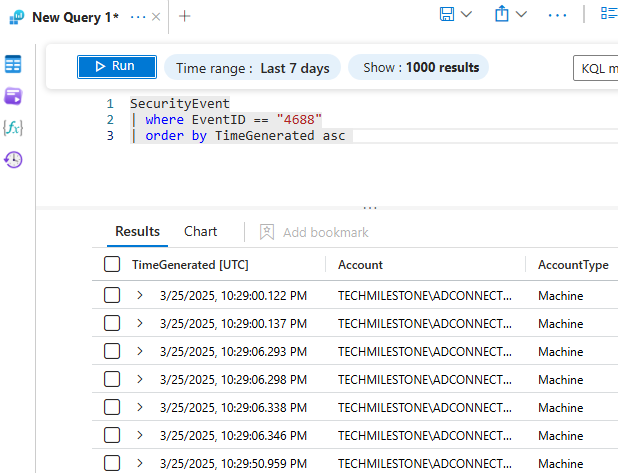
Threat Hunting In Sentinel
In the Sentinel > Hunting blade (Threat Management), in Queries tab, we have some pre-defined hunting queries.
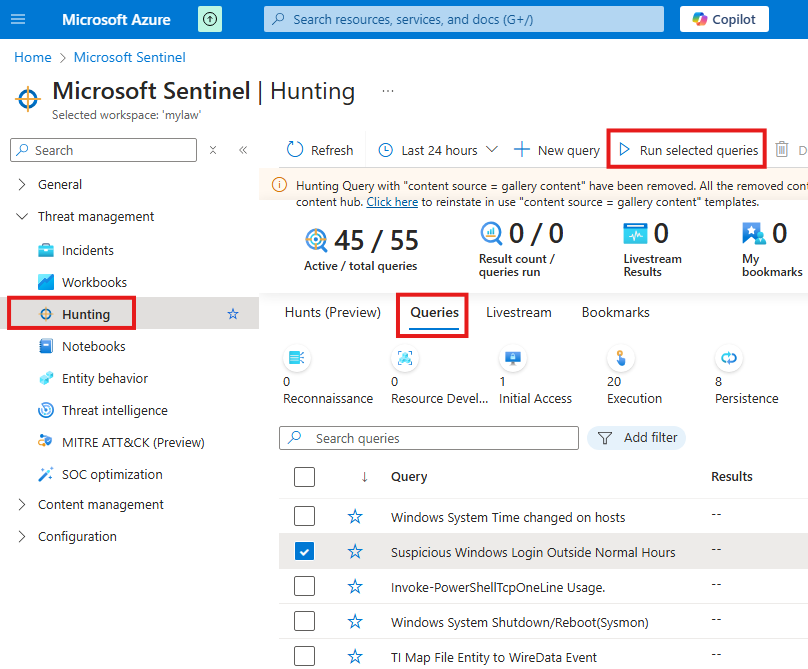
These pre-defined quires are here because we have installed some contents from Content hub, these contents may have queries included in the package.
Hunt For Entra ID Events
To create our own hunt, go to : Hunting blade ( Threat Management) > New Hunt > Create
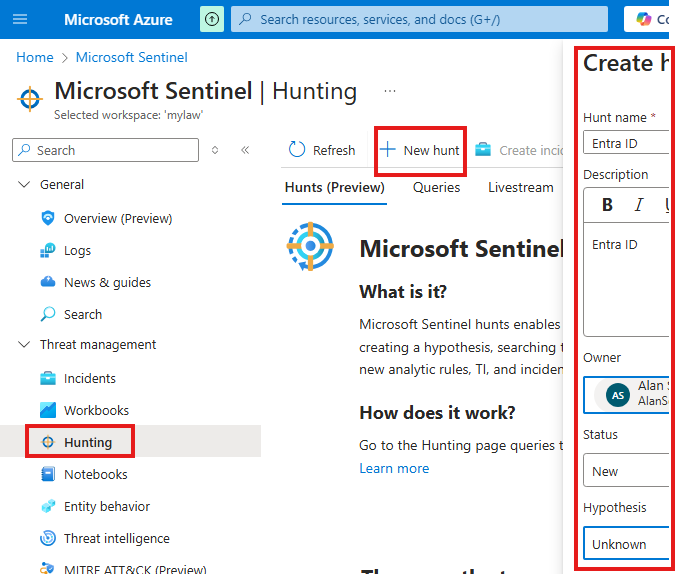
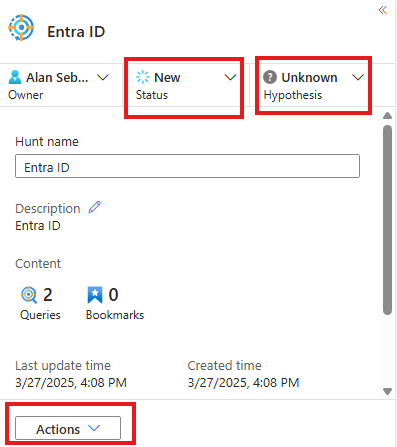
When we create hunt Hypothesis will be unknown.
We can add new queries to our hunt by Query actions > New Query
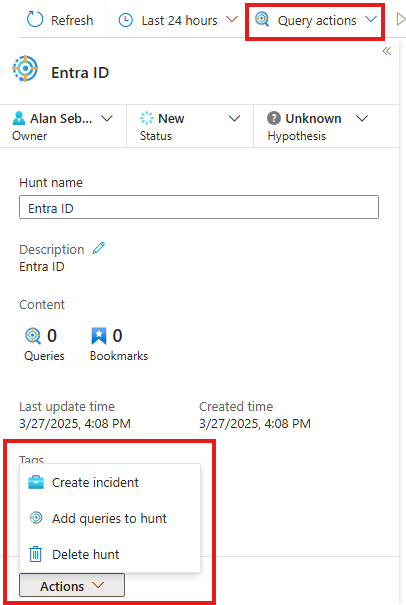
We can add existing predefined queries by going to Add queries to hunt
When
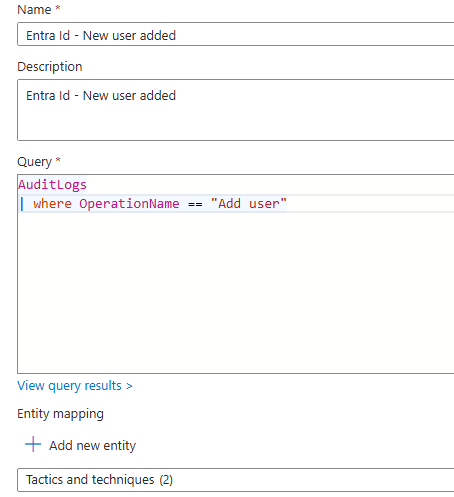
For Tactics and technique we select: Persistence > Create Account > Create cloud account
We can add more queries to hunt
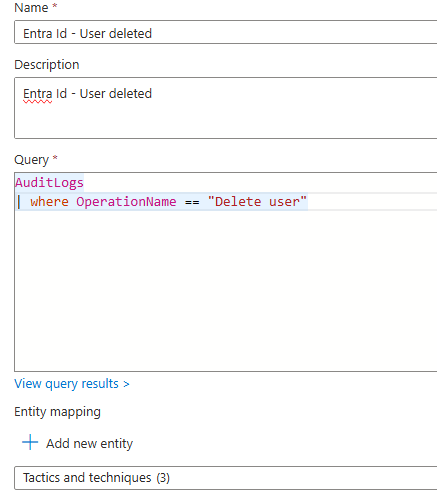
Here Tatics and techniques are : Defense evasion > cloud accounts
Now to test the query
Create and delete user in Entra Id
Now, run all the hunt queries
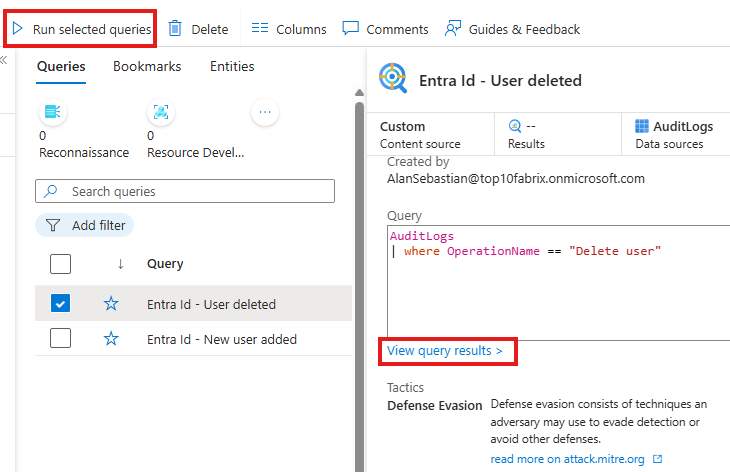
After we run query, we come to a conclusion and we can update our hypotheses to be validated or invalidated. We can also update status of our hunt.
We can then take action to create an incident.
Created incident will be listed in Incidents blade
Hunting Scenarios
To check if any other server has made an HTTP request other that computer with static IP used by admin:
AzureActivity | where HTTPRequest<>dynamic({"clientIPAddress:"92.97.70.71""})AzureActivity table has some fields, HTTPRequest is one of such fields, but its value is JSON, so we cannot normally compare it with <> (not equal) or == (equal) direclty, we need to use method called dynamic().
Section Summary
🔐 What Is Cyber Threat Intelligence (CTI)?
Cyber Threat Intelligence (CTI) is information about known cyber threats—like suspicious IP addresses, domains, or file hashes—collected and shared by security organizations (e.g., Pulsedive).
This threat data helps security teams identify and respond to attacks faster.
🧭 CTI Workflow in Microsoft Sentinel
In Microsoft Sentinel, the CTI process follows this path:
- Inject Threat Intel Data – Logs from external sources (e.g., Pulsedive) are sent to Log Analytics Workspace.
- Search with KQL – Use Kusto Query Language to explore threat data in the
ThreatIntelligenceIndicatortable. - Create Analytics Rules – These rules can automatically flag Indicators of Compromise (IoCs) like malicious IPs.
- Visualize in Workbooks – Create charts and dashboards for better understanding.
- Raise Incidents – If something looks suspicious, convert it to a security incident.
- Automate with Playbooks – Use Logic Apps to automatically take actions (e.g., block IP, disable user).
📦 STIX & TAXII – Sharing Threat Data
- STIX (Structured Threat Information Expression): A common format (JSON) for sharing threat intel.
- TAXII (Trusted Automated Exchange of Indicator Information): A protocol that delivers STIX data over the internet (HTTPS).
Together, they allow automated sharing of threat data between security systems.
☁️ Injecting Threat Intelligence into Sentinel
To add external threat data (like from Pulsedive):
- In Sentinel, install the Threat Intelligence content from Content Hub.
- Choose the TAXII connector from the Data Connectors section.
- Fill in the connection details from Pulsedive’s documentation.
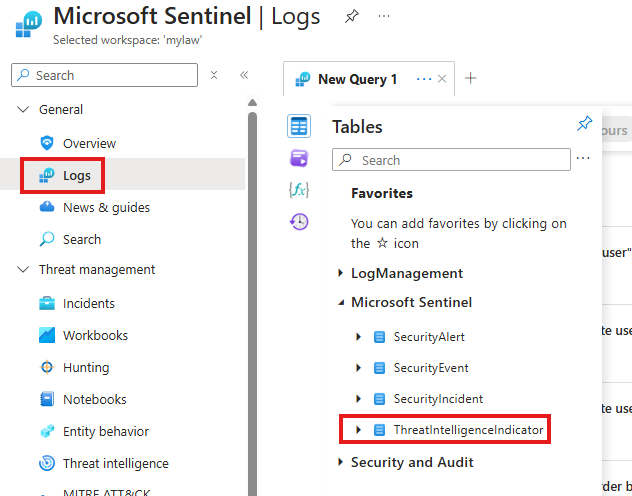
- Once connected, data will start flowing and appear in the
ThreatIntelligenceIndicatortable in Logs.
You can now query this table with KQL to search for any matching threats in your environment.
🧠 UEBA – User and Entity Behavior Analytics
UEBA is a built-in feature in Sentinel that tracks how users and devices behave. It learns “normal” patterns and flags anything unusual.
It considers multiple factors:
- User identity and role
- Location
- Access behavior
- Associated IP addresses
- Known threat indicators
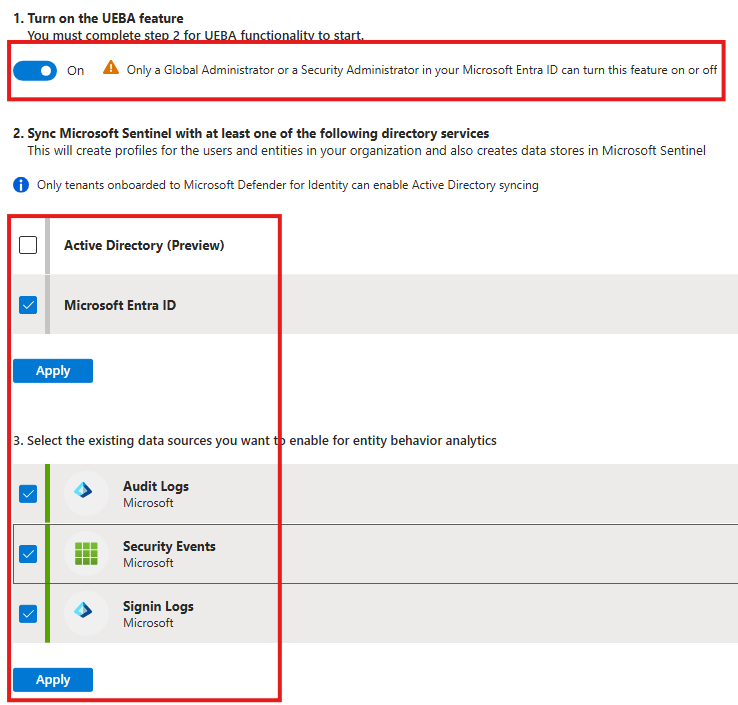
⚙️ Enabling UEBA and Viewing Anomalies
To turn on UEBA:
- Go to Sentinel > UEBA Settings and enable anomalies.
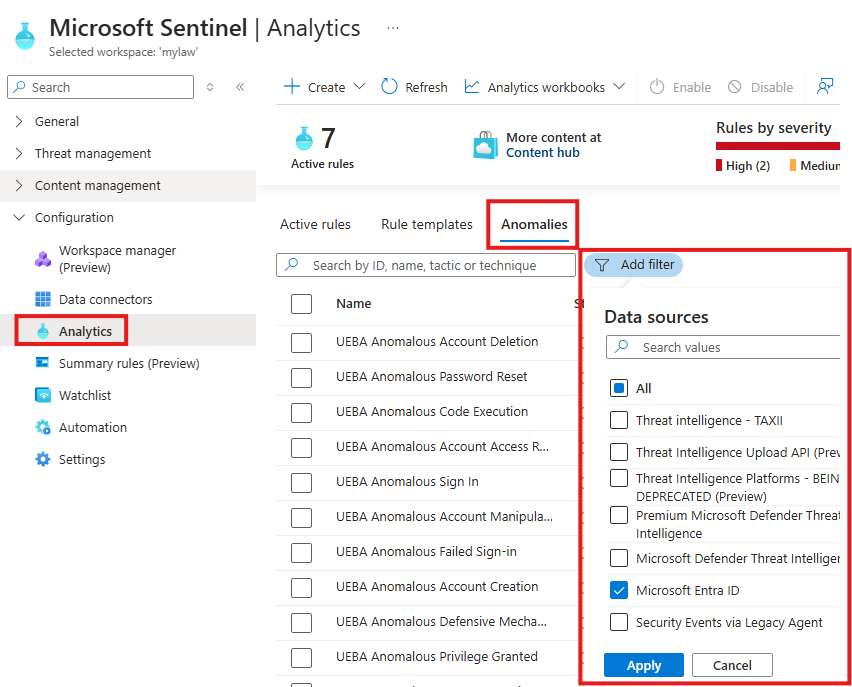
To view detected anomalies:
- Visit Analytics > Anomalies tab.
- Filter by data source (e.g., Entra ID) to view behavior issues related to identity activity.
Although the default anomaly detection can’t be customized, you can duplicate an existing anomaly and adjust it as needed.
Cyber Threat Intelligence (CTI) Workflow in Microsoft Sentinel
When companies make threats they make records of these threats information like IP address. These information is provided by many opensource companies like Pulsedive.
1 – We inject CTI logs to Log Analytics Workspace.
2 -Then, we can do threat hunting using KQL queries on ThreatIntelligenceIndicator table
3 – We can create Analytics Rules to filter for anomalies and IoC
4 – Results can be visualized on Workbooks
5 – If needed we can create Incidents based on our investigation
6 – We create playbooks (Logic Apps) to automate actions
STIX & TAXII
STIX : Structured Threat Information Expression
JSON-based format to share threat intel data.
Used to exchange CTI between systems
TAXII: Trusted Automated Exchange of Indicator Information
Protocol that transmit STIX via HTTPS
Injecting Threat Intelligence to Sentinel
Install content : Threat Intelligence in Sentinel, go to Manage
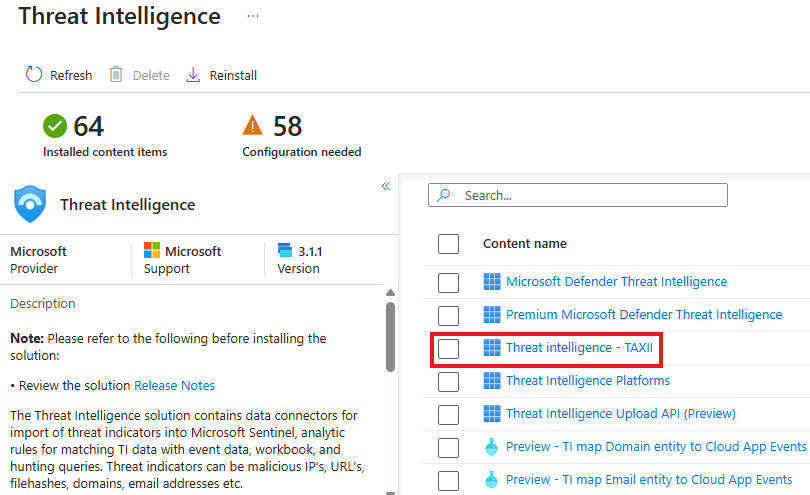
Choose TAXII connector
Go to Connector page, put details to configure the connection from external feed: Pulsedive
We will be injecting test data from Pulsedive
Input configuration details to Connector page from Pulsedive documentaion
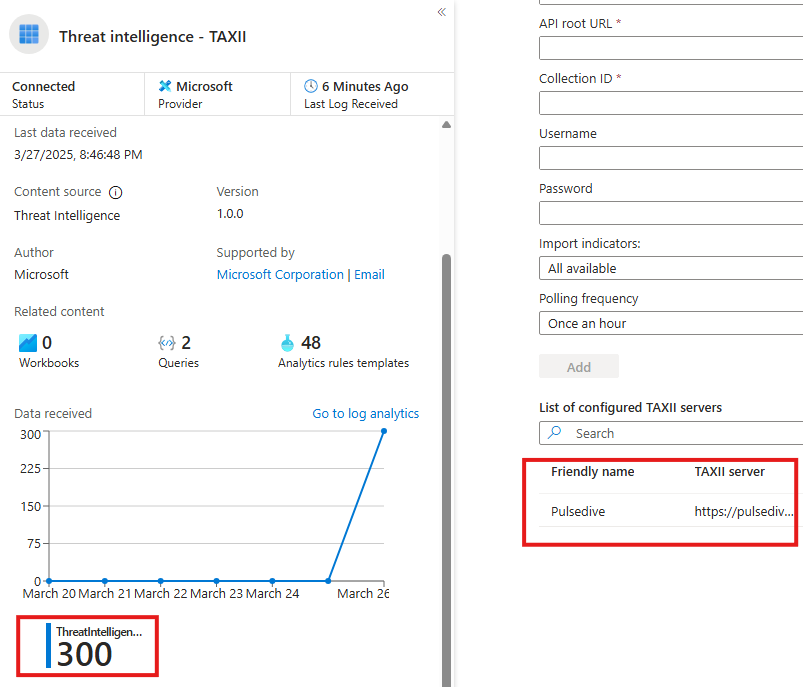
If connection is successful, we will see it, in connector page and under Data Connectors (Configuration) blade
We will also see a new table created, in the Logs section, where we can query using KQL
UEBA : User and Entity Behavior Analytics
Built-in feature that detects abnormal user/entity behavior by establishing baselines.
UEBA is built-in feature of Sentinel, we can enable it.
Identifies base-lines and deviations.
UEBA considers factors like
1 – User resolution
2 – Behavioral profiling
3 – Threat Indicaors
4 – Geolocation resolution
5 – User blast radius
6 – Host IP data
Setting UEBA in Sentinel
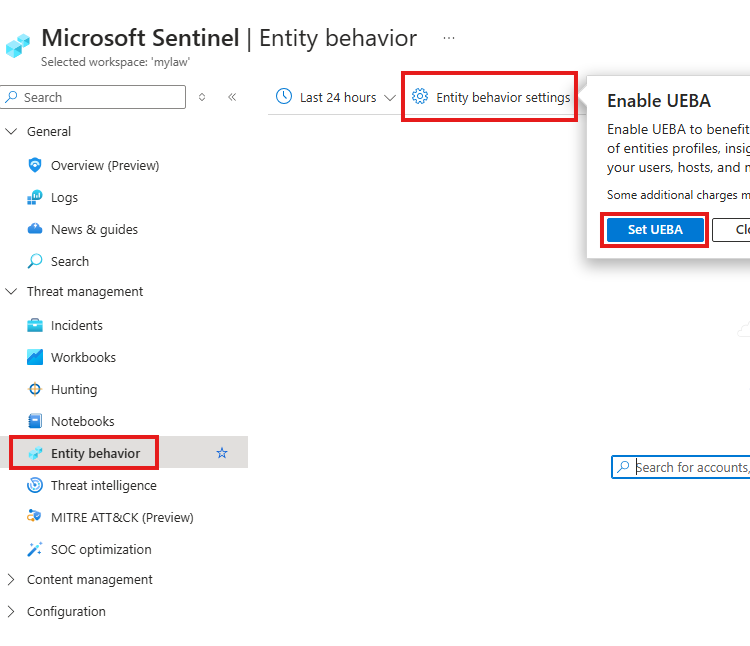
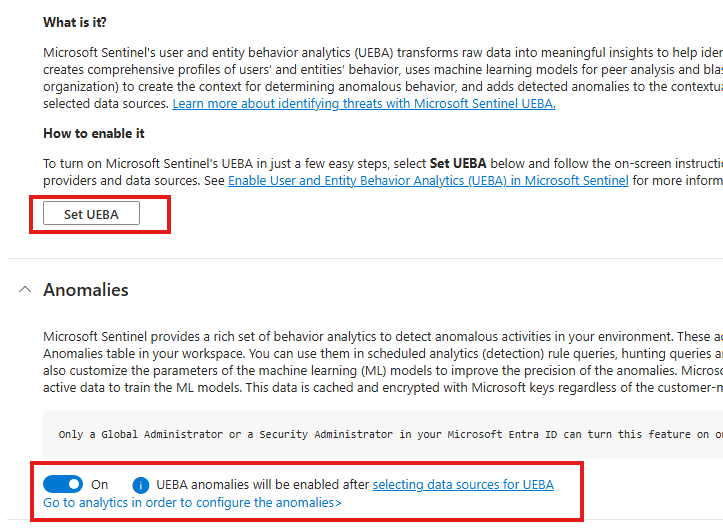
Set UEBA and Turn on Anomalies
To view the anomalies about Entra injection:
Go to Analytics blade > Anomalies tab, and filter data by data source, select Entra ID
Here we cannot tune/configure built-in anomalies provided by Microsoft.
But, we can Right Click > Duplicate an anomaly and edit it
Section Summary
🛡️ What Is SOAR?
SOAR stands for Security Orchestration, Automation, and Response.
It allows Microsoft Sentinel to automatically respond to security incidents by:
- Running automation rules
- Triggering logic-based workflows (Playbooks)
- Reducing manual investigation effort
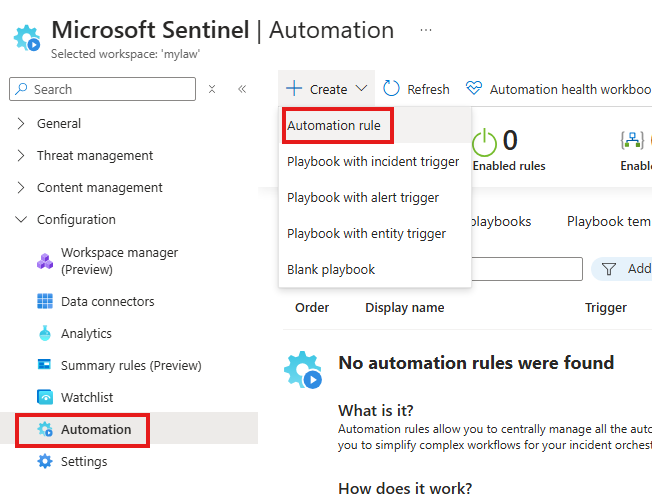
⚙️ Automation Rules in Sentinel
Automation Rules trigger when an incident is created by an Analytics Rule.
For example:
- You create an analytics rule that detects new user accounts.
- When a new user is added, this rule raises an incident.
- An automation rule can then change incident severity or update its status automatically.
How to verify automation:
- Go to your Analytics Rule > Automated Response tab.
- You’ll see if any Automation Rule is linked.
- This ensures two-way visibility between rules and automation.
🔁 Playbooks (Logic Apps)
Playbooks are workflows created using Azure Logic Apps. They can:
- Send notifications
- Enrich incidents with data
- Trigger alerts or updates
Example:
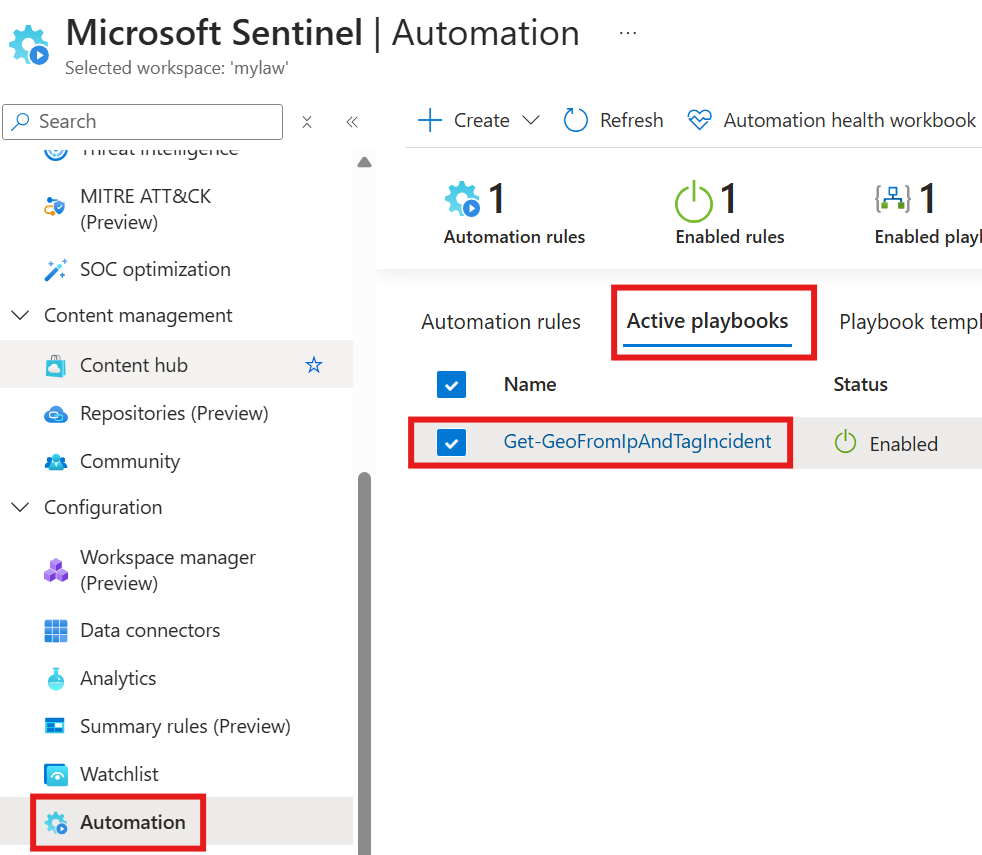
Installing the Microsoft Sentinel Training Lab content gives you a sample playbook:
📌 Get-GeoFromIpAndTagIncident – It finds the location of an IP and tags the incident accordingly.
Before using a playbook, you must:
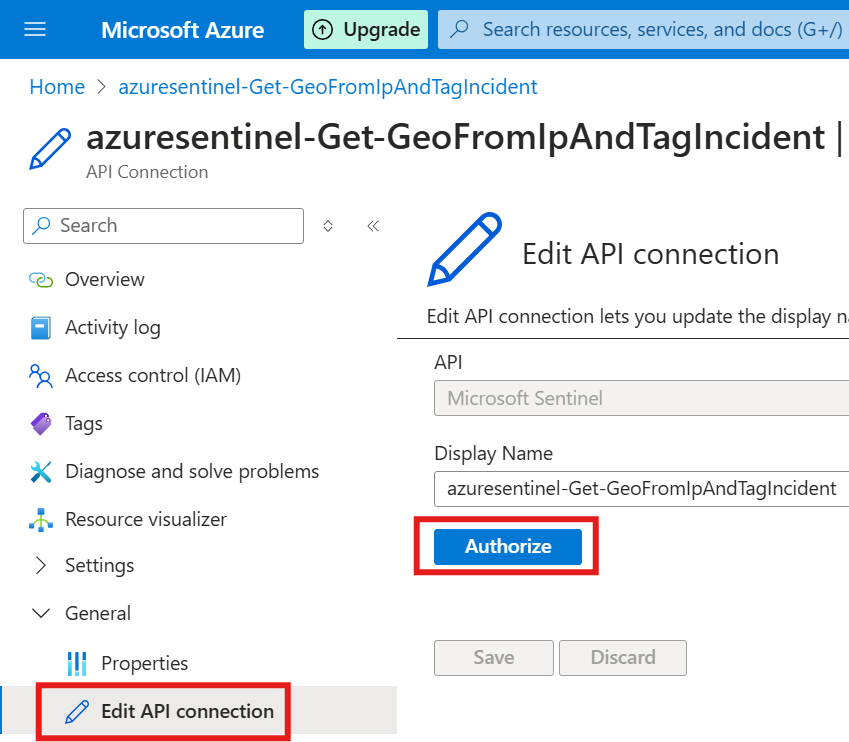
- Authorize it – Edit the API connection resource and provide the correct permissions.
- Assign RBAC roles – Give the Logic App resource access to work with Sentinel.
- Use Managed Identity – So the app can connect securely without passwords.
🚀 Running a Playbook on an Incident
You can manually run a playbook from:
- Sentinel > Incidents
Just pick an incident and trigger the playbook.
This is useful if you want to test or apply actions to a specific incident.
🤖 Playbooks with ChatGPT & MITRE ATT&CK
Sentinel allows you to build playbooks that:
- Use MITRE ATT&CK techniques to understand attack patterns.
- Connect with ChatGPT to explain incidents and suggest actions.
Example:
- Trigger: Incident detected using MITRE tactic.
- Action 1: Use ChatGPT to generate a helpful comment.
- Action 2: Post this comment back into the Sentinel incident automatically.
This makes incidents easier to understand for your team.
🔐 Permissions for Playbooks
For playbooks to work correctly:
- Assign the Sentinel Contributor role to the playbook’s managed identity.
- Do this from:
Logic App > Identity > Role Assignment
This gives it permission to read, update, or tag incidents in Sentinel.
📡 Sentinel APIs for Advanced Automation
Sentinel also supports automation using APIs:
- Sentinel Management API – Manage rules, incidents, and more.
- Microsoft Graph API – Interact with Entra ID (Azure AD), users, groups, etc.
- Azure Log Analytics API – Run KQL queries and access logs.
- HTTP Data Collector API – Send custom data into Sentinel.
You can use these APIs to build your own tools or integrations with Sentinel.
⚙️ Automation Rules
- Purpose: Trigger actions automatically when an incident is created.
- Tied to a specific Analytics Rule.
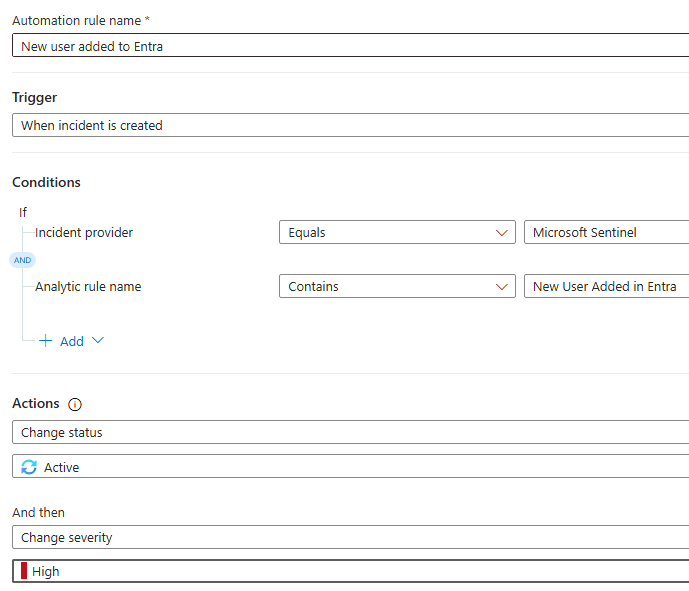
Here we are creating an automation rule that will run when an incident is created, as a result of running an Analytic rule that is already we created.
Verify the link between Analytics rule and Automation rule
Since we used an Analytics rule in our Automation rule, there is a 2-way link. We will be able to see the related Automation rule from Automated response tab of the Analytics rule.
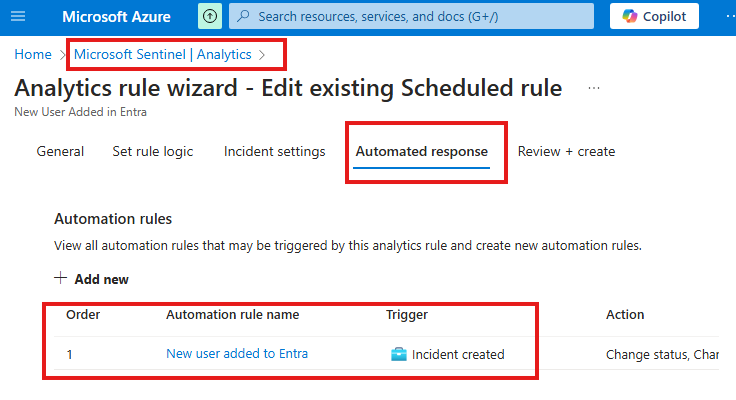
Here we can see if there is any Automation rules created using this Analytics rule.
Verify Automation Rule
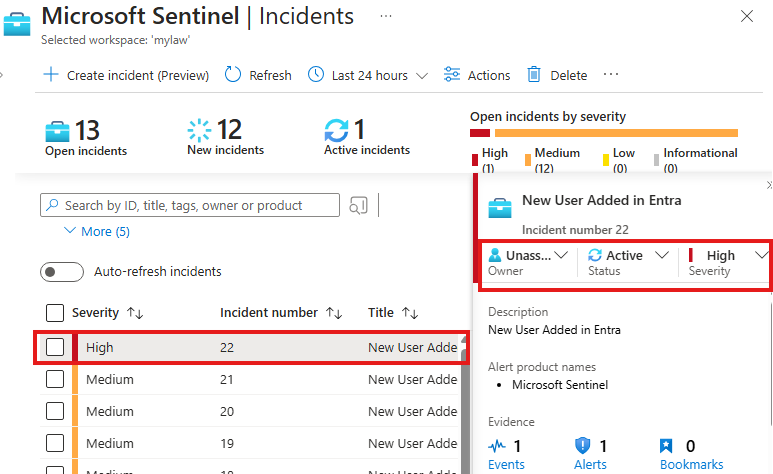
Now, the Scheduled Analytics Rule, that will look for new user added in Entra every 5 minutes, will create an incident when a user is created.
Then, Automation rule will kick-in to make it Severity high and Status Active.
Playbooks
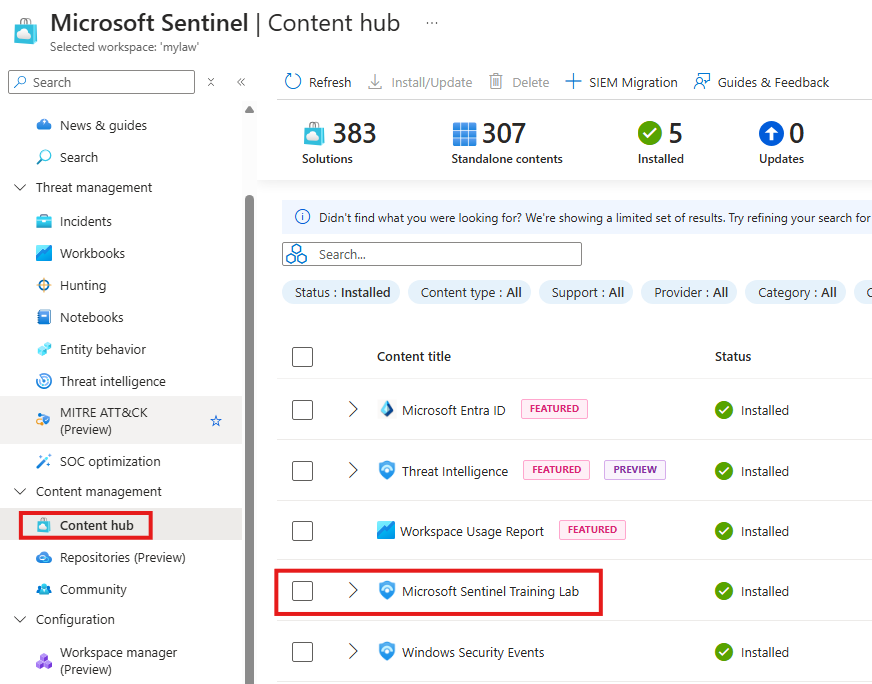
When you install a content solution called: Microsoft Sentinel Training Lab, we will get a Playbook called: Get-GeoFromlpAndTagIncident
Authorizations for Playbook
But, first we need to give authorization for this playbook to work with our environment. For that we need to find the related API Connection resource created along with it: azuresentinel-Get-GeoFromIpAndTagIncident, and Edit it.
We also need to configure Playbook permissions in Sentiinel.
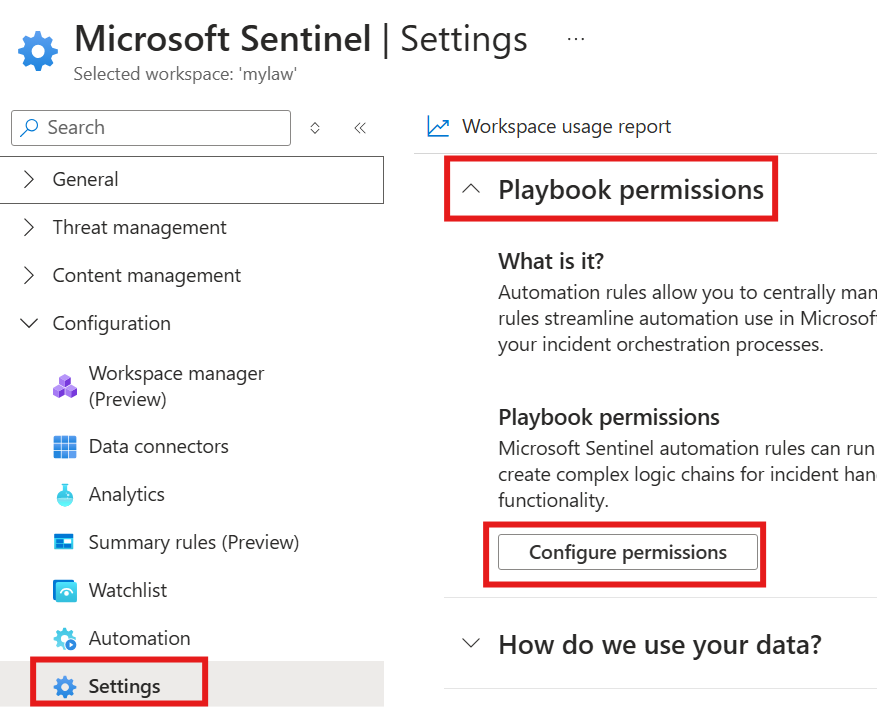
Here we select Resource groups over which this playbook will have permission
We also need to use managed identity for connection.
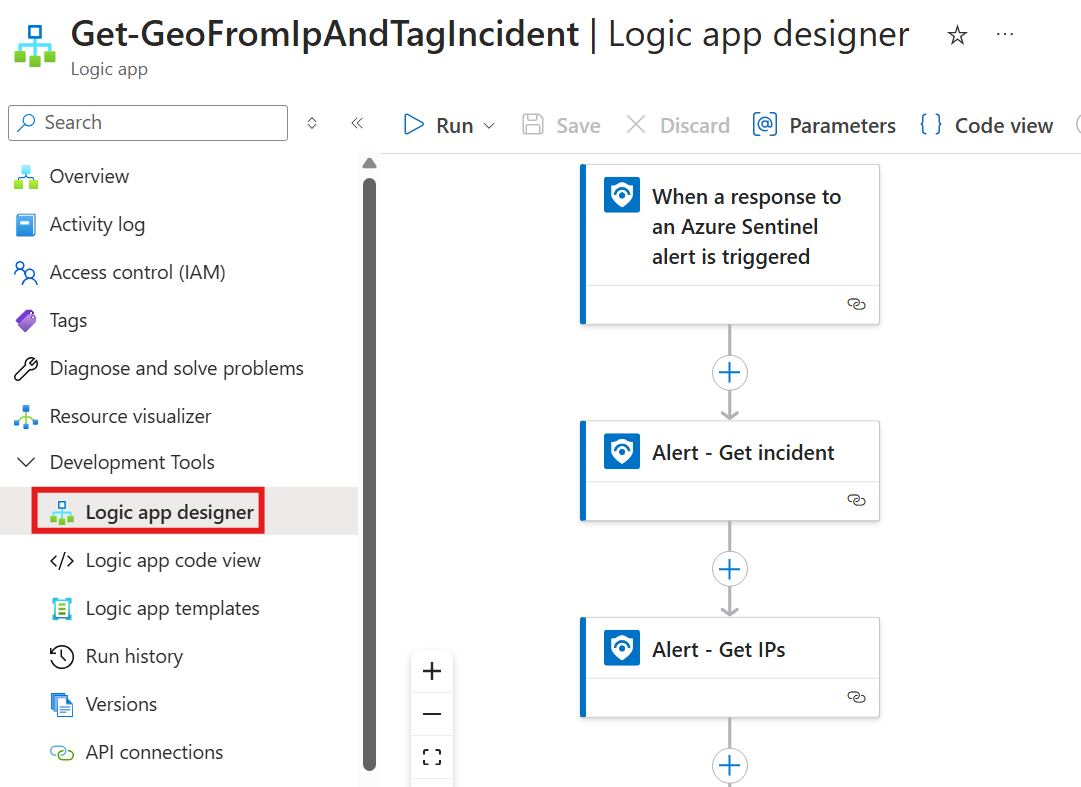
Go to Logic app designer of the Logic App resource created with the content solution
We need to connect using OAuth, so that logics can work on Sentinel.
Run Playbook
Go to Sentinel > Incident
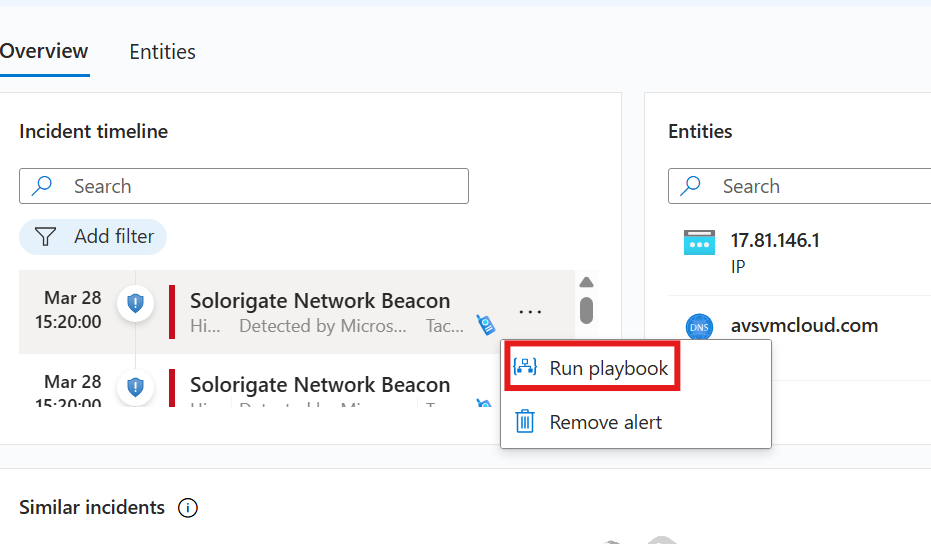
Here, we can run playbook on incident.
Playbooks: MITRE ATT&CK & ChatGpt
Go to Sentinel > Automation > Create : Playbook with incident trigger
For the created Playbook (Logic App) resource, add a RBAC role of Sentinel Contributor
Identity blade (settings) > Role Assignment (System assigned tab)
We can create an action that will prompt ChatGpt to enrich incident with explanation:
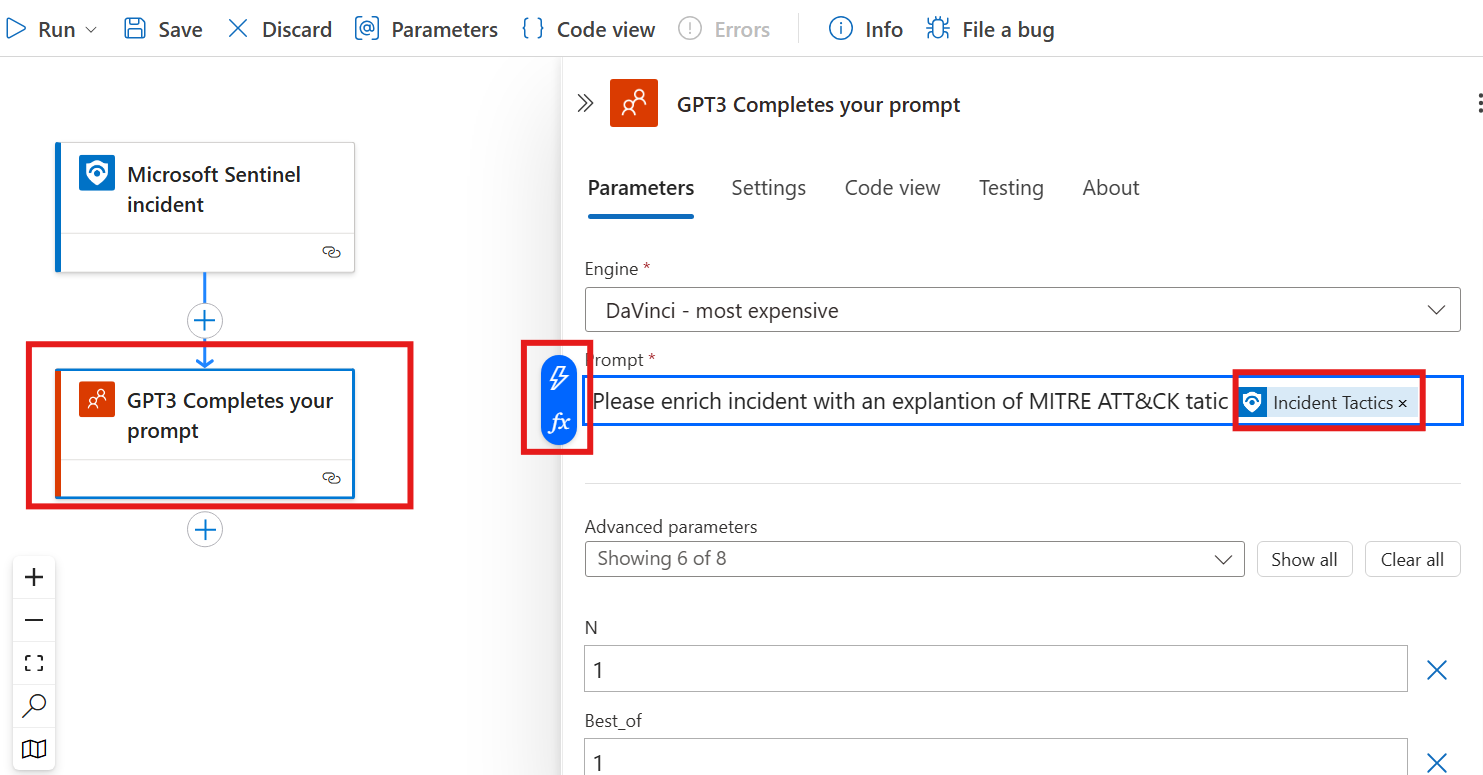
To the prompt we can add dynamic content like a variable of Incident Tatics.
Then we can also add next action that will put a comment.
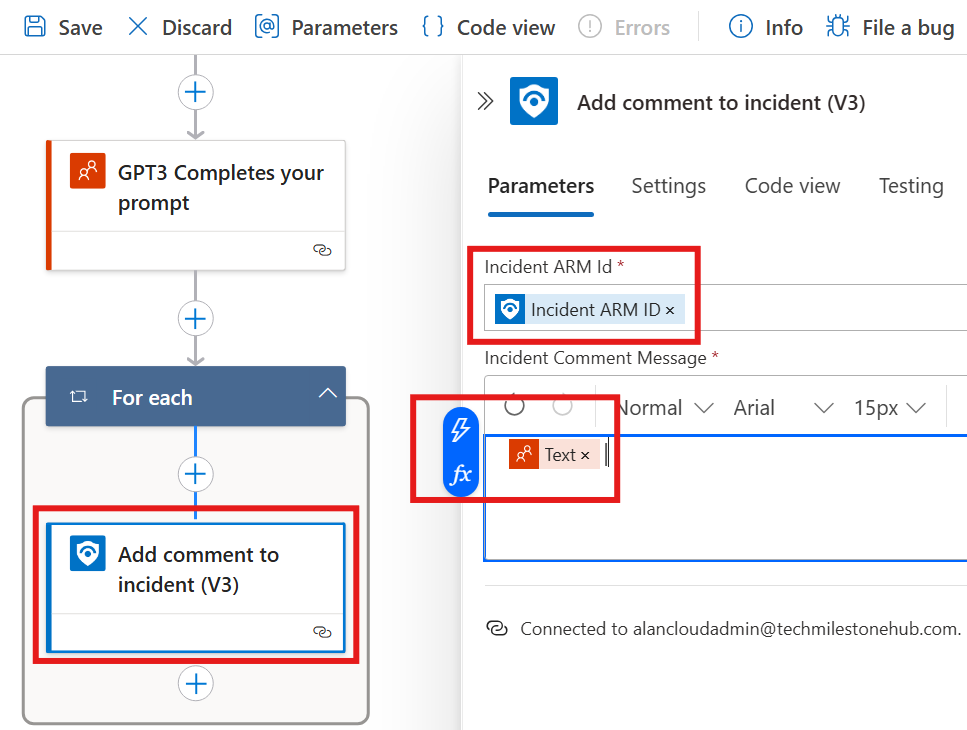
Here dynamic variable: Text will be from previous action.
Now, when we run this playbook for an incident in Sentinel, that incident will be modified by adding comments by running the playbook.
First action, will generate a comment with ChatGPT.
Second action, will put the text output in the comment section of the incident.
Sentinel APIs
1 – Sentinel Management API
2 – Microsoft Graph API
3 – Azure Log Analytics API
4 – HTTP data collector API
Section Summary
📊 Workbooks – Visualizing Security Data
Workbooks are dashboards in Microsoft Sentinel used to visualize data collected from various sources.
- You can create graphs, tables, and charts to explore and present security trends.
- Workbooks can be created from scratch or come pre-installed with content solutions (like Threat Intelligence or VM logs).
Example:
A workbook installed with a Threat Intelligence solution may show dashboards of detected malicious IPs.
📝 Create Your Own Workbook
- Go to Sentinel > Workbooks > Click Add workbook
- Use the Edit button to add custom visualizations like charts, tables, etc.
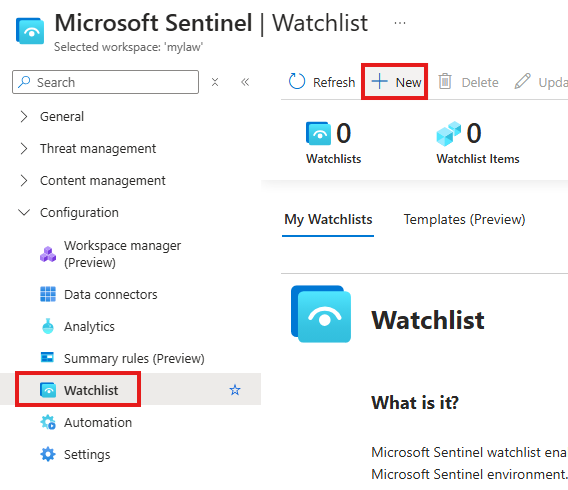
📋 Watchlists – Custom Lists for Threat Detection
Watchlists are custom lists (like CSV files) that you upload into Sentinel.
They’re useful for referencing specific entities in your KQL queries.
🔒 Common Use Cases:
- VIP users
- Former employees
- Stolen devices
- Critical assets
🛠️ How to Use:
- Upload a CSV file (e.g., list of IP addresses or usernames).
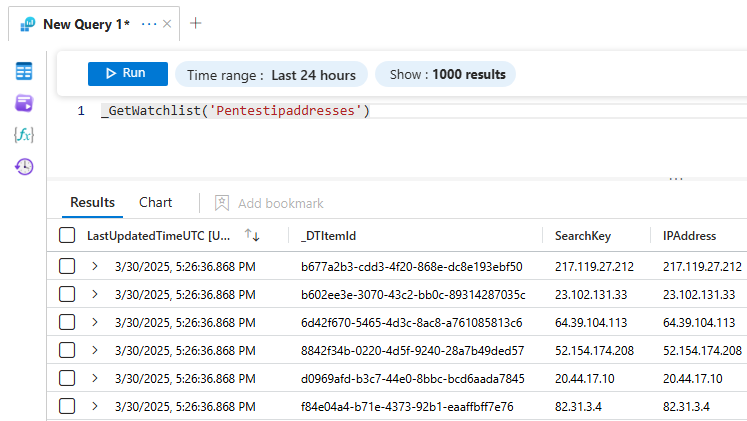
- In your query, use:
_GetWatchlist("your-watchlist-name")
This lets you match logs against your list.
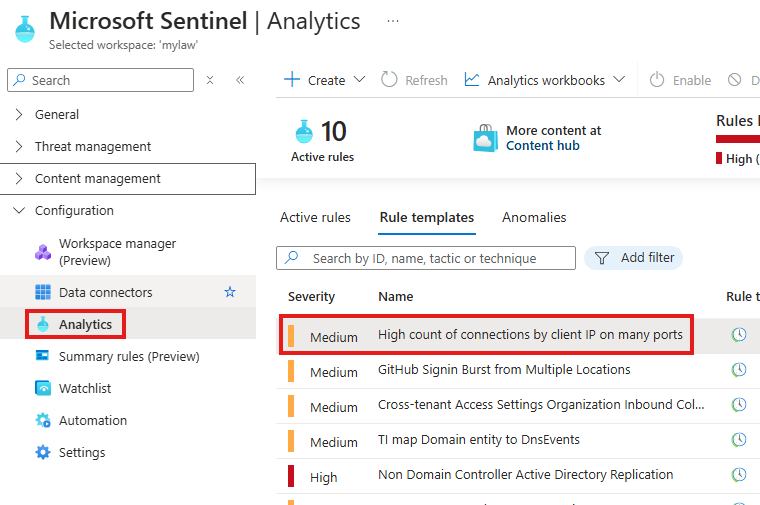
✅ Integrate with Analytics Rules
- Install a solution like “High count of connections by client IP”.
- Inside the analytics rule, reference your watchlist in the query using
_GetWatchlist().
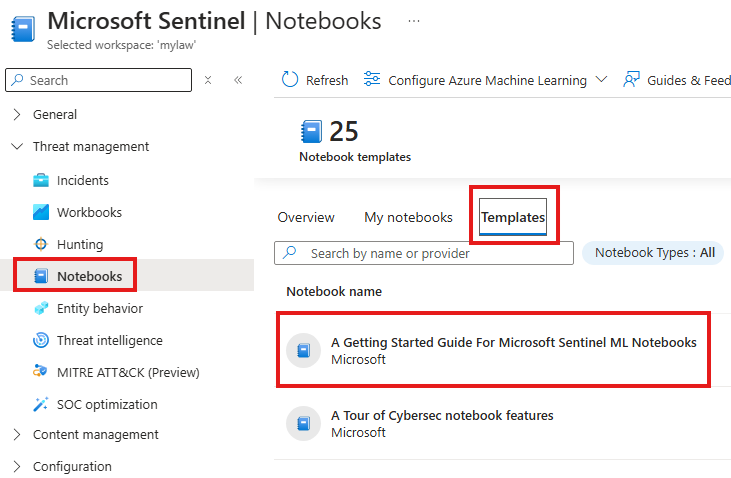
🧪 Notebooks – Advanced ML & Analysis with Python
Notebooks allow you to run Python code (Jupyter Notebooks) for deep analysis, visualization, and machine learning.
🔧 Setup Steps:
- Create an Azure ML Workspace.
- Launch the notebook via Sentinel.
- Create or select a compute (virtual machine) for Python code to run. This compute resource has a cost.
- Use MSTICPy, a library for security investigations in Sentinel.
🚀 Notebooks are powerful, but best suited for data scientists or advanced analysts.
💰 Cost Optimization in Sentinel
🧾 Legacy Pricing Model
You pay separately for:
- Sentinel service
- Log Analytics Workspace
- Data Retention
- Advanced features like Logic Apps
📉 New Pricing Model (Commitment Tiers)
- No separate charge for Log Analytics.
- Pay based on daily data volume (GB/day).
- Choose a tier that matches your usage for cost savings.
🧠 Log Types
- Analytics logs – Used for real-time alerts and threat hunting
- Basic logs – Lower cost, limited features
- Archive logs – Very low cost, no search unless restored
You can move expired analytics logs to archive for long-term storage and restore if needed.
📊 Cost Optimization Workbook
You can install a special Optimization Workbook from the Content Hub to:
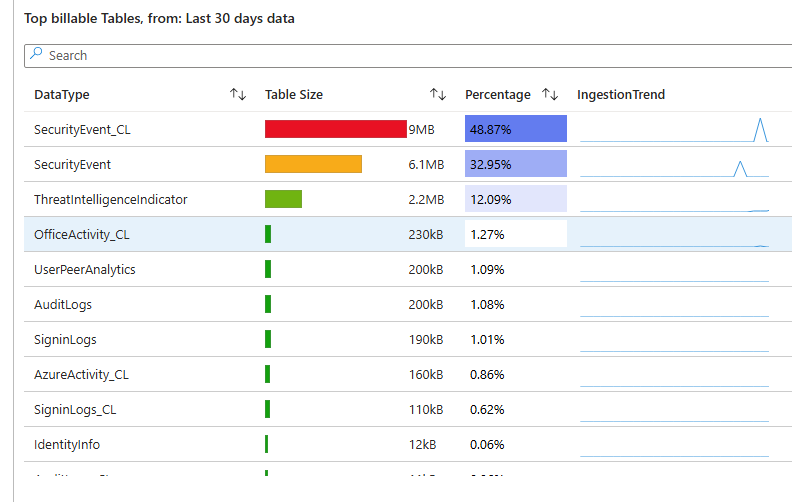
- View which data sources inject the most data
- Identify potential cost-saving opportunities
You can also save this workbook to refer back later.
📦 Long-Term Retention Options
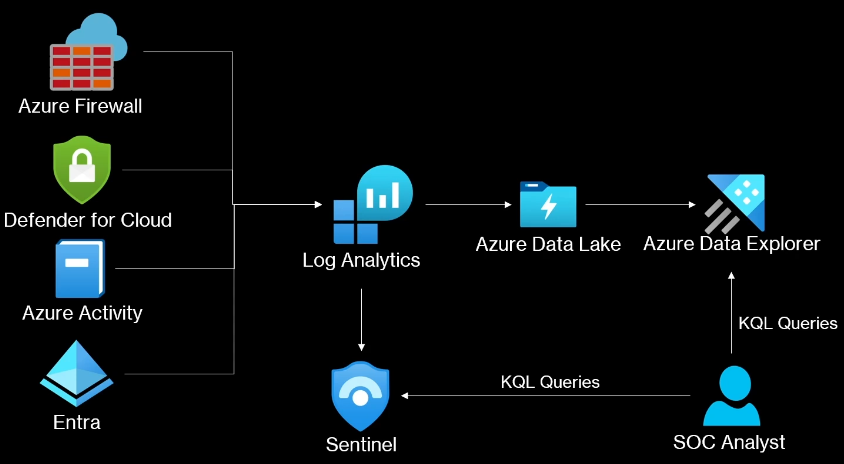
🔷 Azure Data Explorer (ADX)
- Separate analytics platform, not part of Sentinel
- Cheaper than Sentinel’s analytics storage
- No SIEM or automation features
- You must manually write KQL queries to do threat hunting
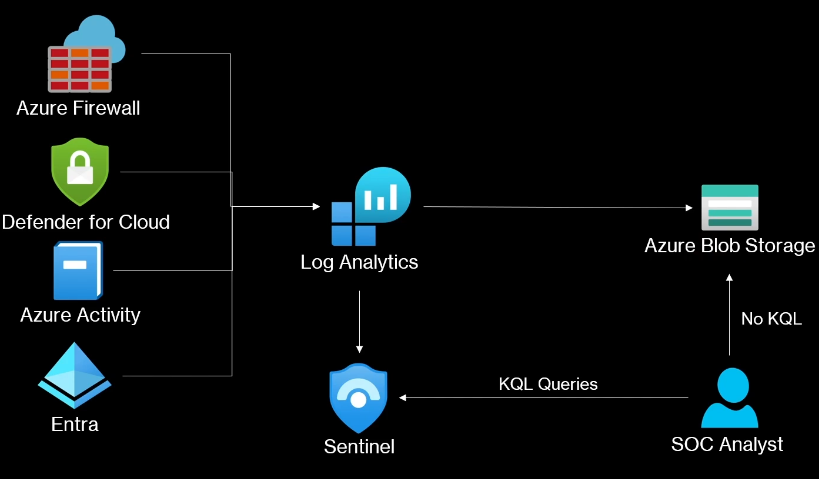
🟦 Azure Blob Storage
- Basic file storage (no analysis tools)
- Very cheap
- No SIEM or SOAR features
- Analysts must re-ingest data into Sentinel for any analysis
Workbooks
Used to visualize data.
Workbook Templates
We will get workbook included when we install content solutions.
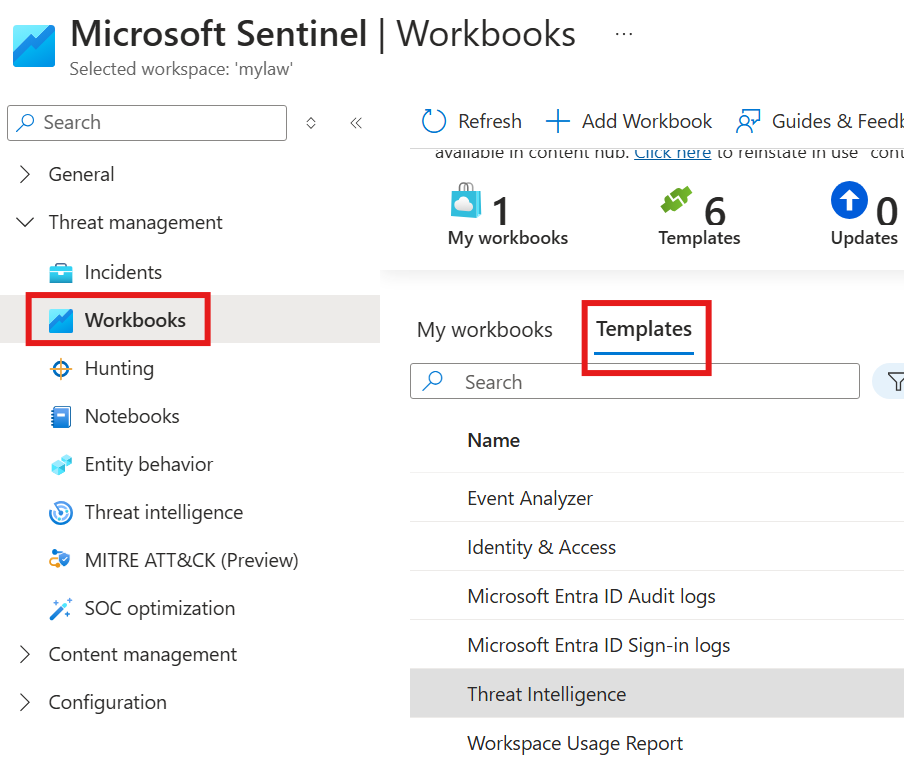
This is workbook template that got installed with Threat Intelligence content solution.
We, will also have option to Save the workbook.
Create Workbook
Click on Add workbook
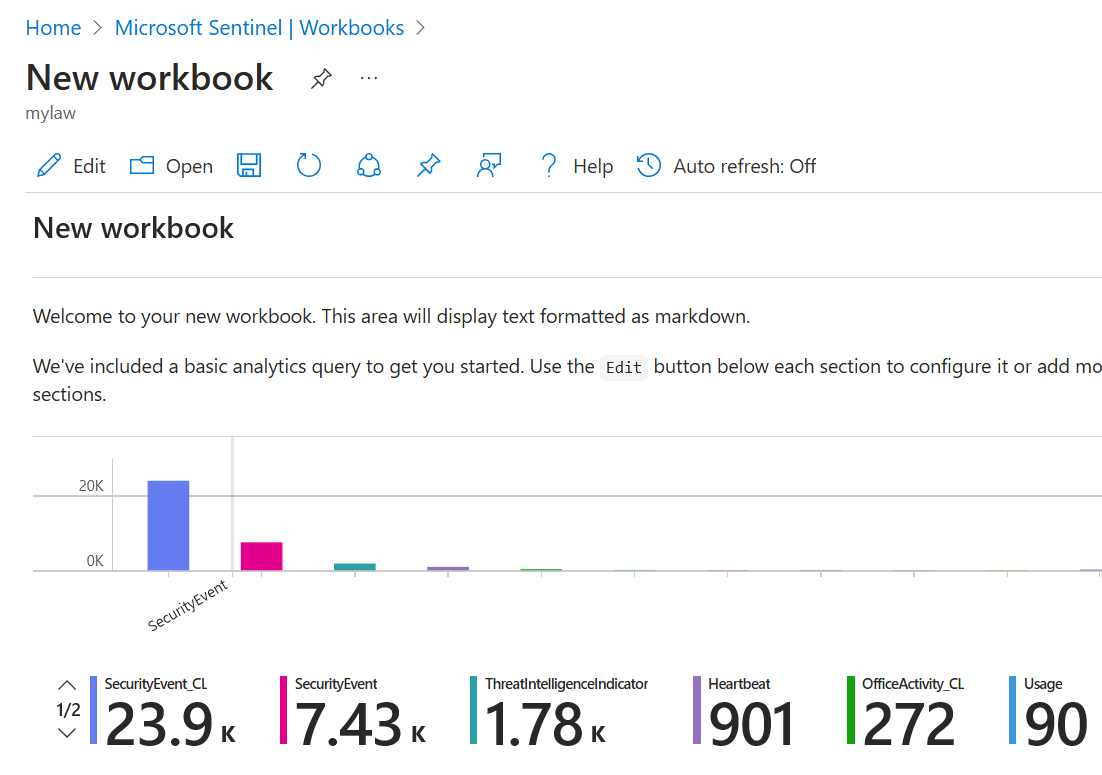
Click Edit and we can add new visualizations.
Watchlists
A static list that can be referenced in KQL queries.
1 – VIP
2 – Former employee
3 – Lost & Stolen
4 – Exceptions
5 – Critical Assets
We can upload a CSV of IP addresses.
We can query the watchlist in Logs section using KQL function _GetWatchlist()
Integrate Watchlist with Analytics Rule
We will install a content solution called: High count of connection by client IP on many ports
We will be working on Analytics rule that will come with this content solution.
Select the analytics rule, click create rule and work on it.
Here, in the query we can inject watchlist using _GetWatchlist() KQL function
Notebooks
Allows us to use python Jupyter notebooks for ML, visualization and data anlysis.
We can create notebook from available template.
We first need to create Azure ML workspace, Notebook will be created on top of Azure Machine learning workspace.
No, we can click on Launch Notebook, it will take us to : Azure ML Studio.
We need to create/select a new compute for the python code to run.
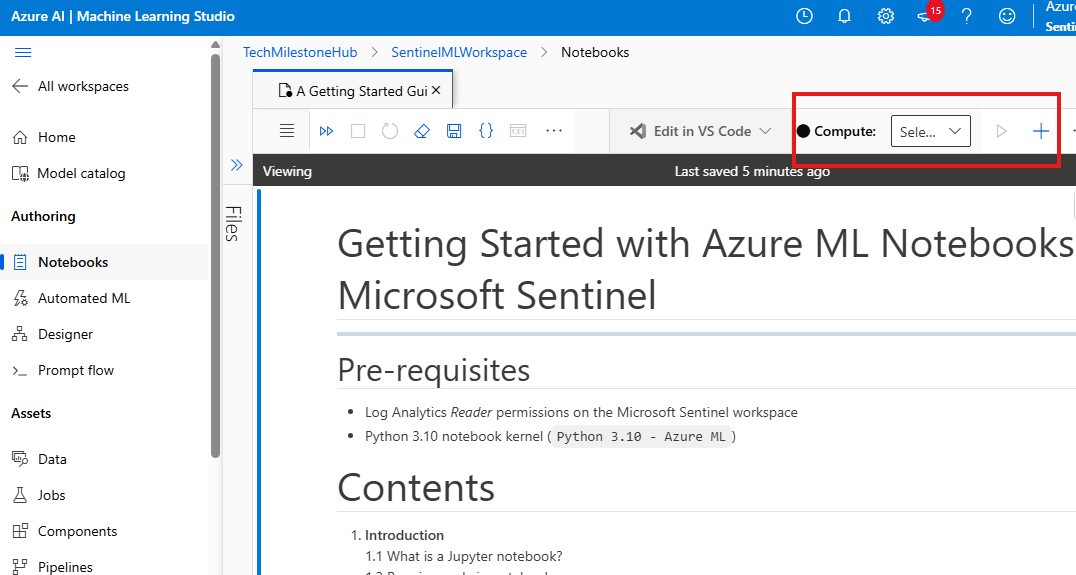
This will have associated costs. This compute will have an python Kernel.
MSTICPy is the python library, that will be used.
Run codes in getting started section
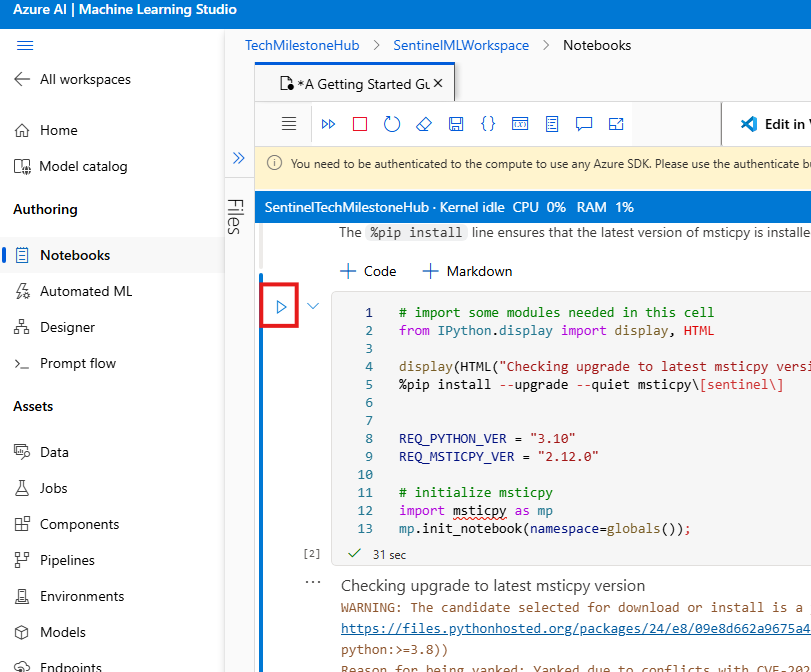
The getting started code will be about:
1 – Initializing Notebook
2 – Verifying Sentinel settings, etc
Cost Optimization
Legacy Pricing model
In the legacy model, cost will be incurred for :
1 – Sentinel
2 – Log Analytics Workspace
3 – Data retention
4 – Advanced capabilities (logic apps etc.)
New Pricing Model
New pricing model, don’t have log analytics
Commitment tiers
Cost tires, based on data in GB injected per day.
Log Types
1 – Analytics: for threat hunting
2 – Basic
3 – Archive : Low cost
When retention expires for Analytics logs it can be transferred to Archive logs. If you want to work with old logs again, we need to restore it from archive.
Cost Optimization Workbook
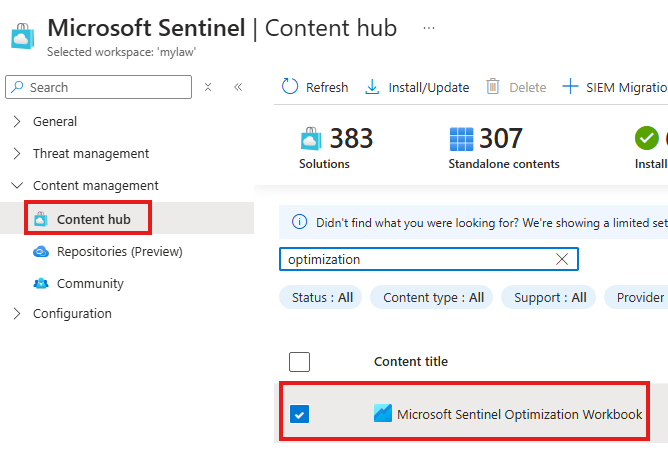
Install and configure Optimization Workbook from Content hub.
in View Templates, we can see top injections of data
We can save this workbook if we want.
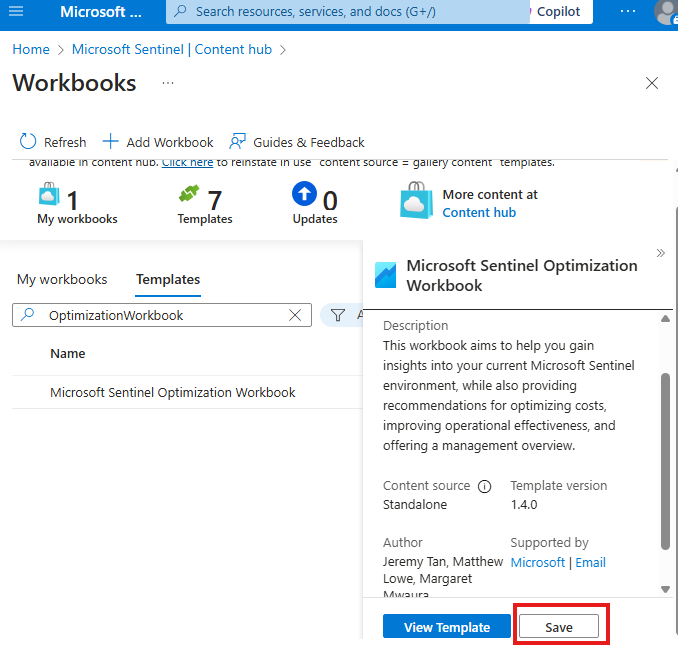
If saved, we can see that in the workbooks.
Long Term Retention
Azure Data Explorer(ADX)
ADX is separate service not Sentinel feature
No SIEM or SOAR available for ADX.
We have to manually do threat hunting using KQL queries.
Storing data in ADX and Data lake is more cheaper that Analytics tier of Sentinel.
Azure Blob Storage
No SIEM or SOAR
No threat hunting with KQL
Simple PaaS storage.
For threat hunting, SOC analyst have to reinject it into Sentinel.
Section Summary
🏗️ Sentinel as Infrastructure as Code (IaC)
Infrastructure as Code (IaC) means you can manage and deploy Microsoft Sentinel resources using code, rather than clicking through the portal manually.
This makes it easier to:
- Automate deployments
- Track changes with version control (like Git)
- Use CI/CD tools like Azure DevOps
🛠️ Common IaC Tools for Sentinel
- ARM Templates
- Azure-specific
- Written in JSON
- Official Microsoft way to describe and deploy Azure resources
- Azure Bicep
- Also Azure-specific
- Easier, cleaner syntax than ARM JSON
- Converts to ARM behind the scenes
- Terraform
- Works with multiple cloud platforms
- Popular for large-scale deployments
- Can also manage Sentinel resources in Azure
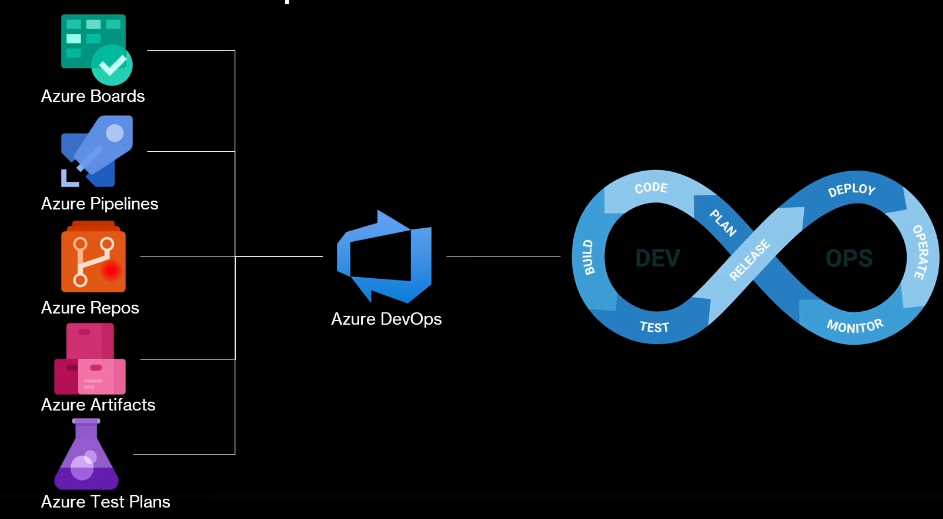
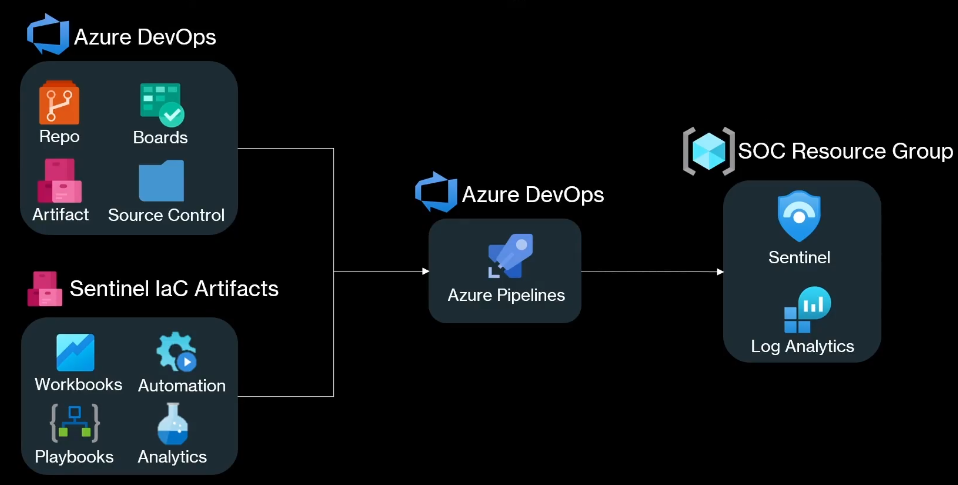
🚀 Deploying Sentinel with Azure DevOps
You can automate Sentinel setup using Azure DevOps, a cloud-based CI/CD platform.
🔌 Step 1: Connect Sentinel to Azure DevOps
- Go to Azure DevOps > Organization Settings > Policies
- Enable third-party access via OAuth
- This allows Sentinel to connect to your DevOps project
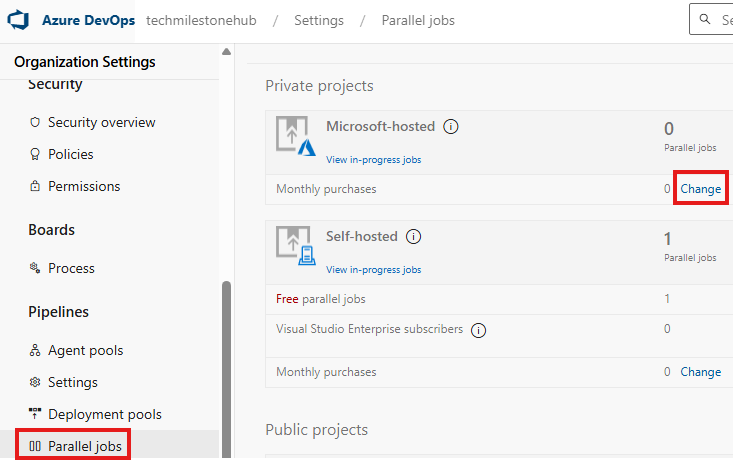
🛍️ Note: You may need to purchase a parallel job in DevOps to run deployments.
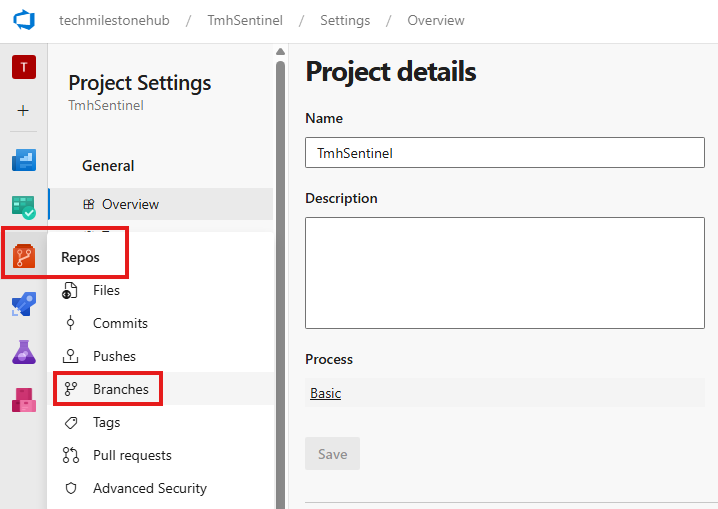
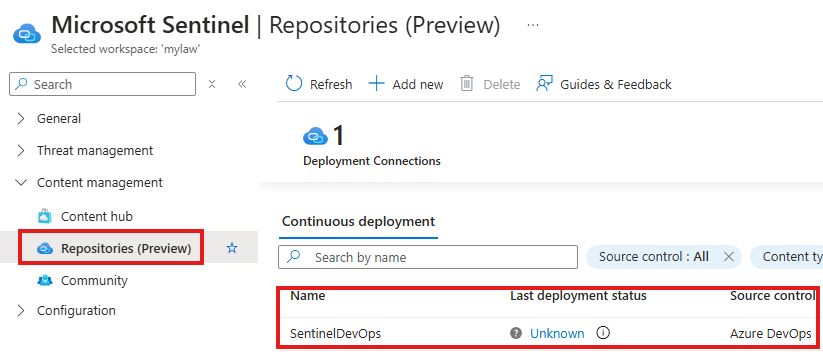
🗂️ Step 2: Add DevOps Repository in Sentinel
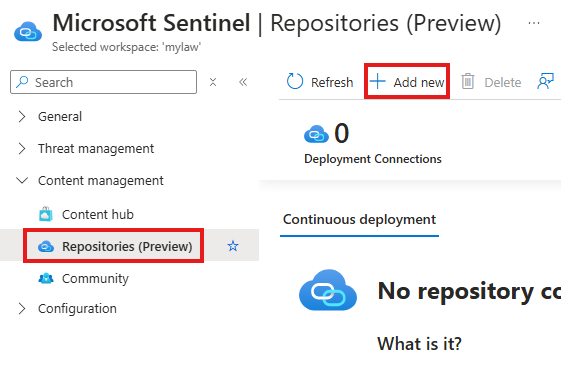
- Go to Sentinel > Repositories > Add New
- Choose your Azure DevOps repository
- Select all available content types (rules, workbooks, etc.)
- Click Create and wait for connection to establish
After this, you can push and pull Sentinel configurations using your DevOps repo.
🧾 Step 3: Manage Analytics Rules with ARM
You can export existing analytics rules from Sentinel and manage them as code.
- Export a rule from the Sentinel portal
- Open the exported JSON file in Visual Studio Code
- Look for the KQL query inside the JSON under the
querykey - Edit or create new rules in code
- Push the file to your main branch in the repository
🚫 In real-world scenarios, avoid drag-and-drop — use Git CLI commands to commit and push your changes.
Sentinel As Infrastructure as Code
We can create/manage sentinel using following Infrastructure as Code ways:
ARM Templates
ARM is Azure specific.
JSON file
Azure Bicep
Declarative code syntax
Also, Azure specific
Terraform
Can be used outside Azure.
Sentinel Deployment using Azure DevOps Overview
Setup Sentinel Azure DevOps Connection
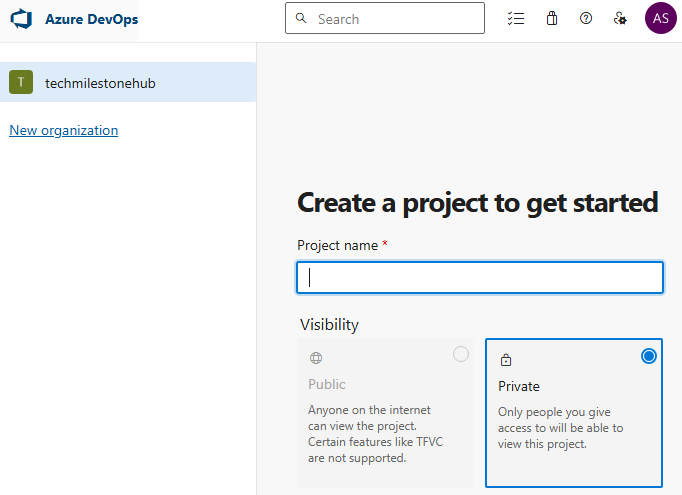
Start DevOps organization from Azure portal
Allow 3rd party connection via OAuth
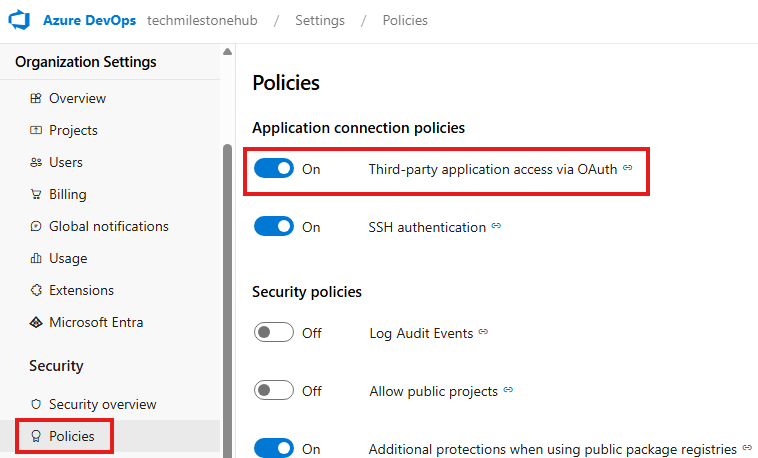
Do this from organization settings > Policies
We now have to purchase a parallel job.
Configure repository in Sentinel
Initialize Main branch in repository
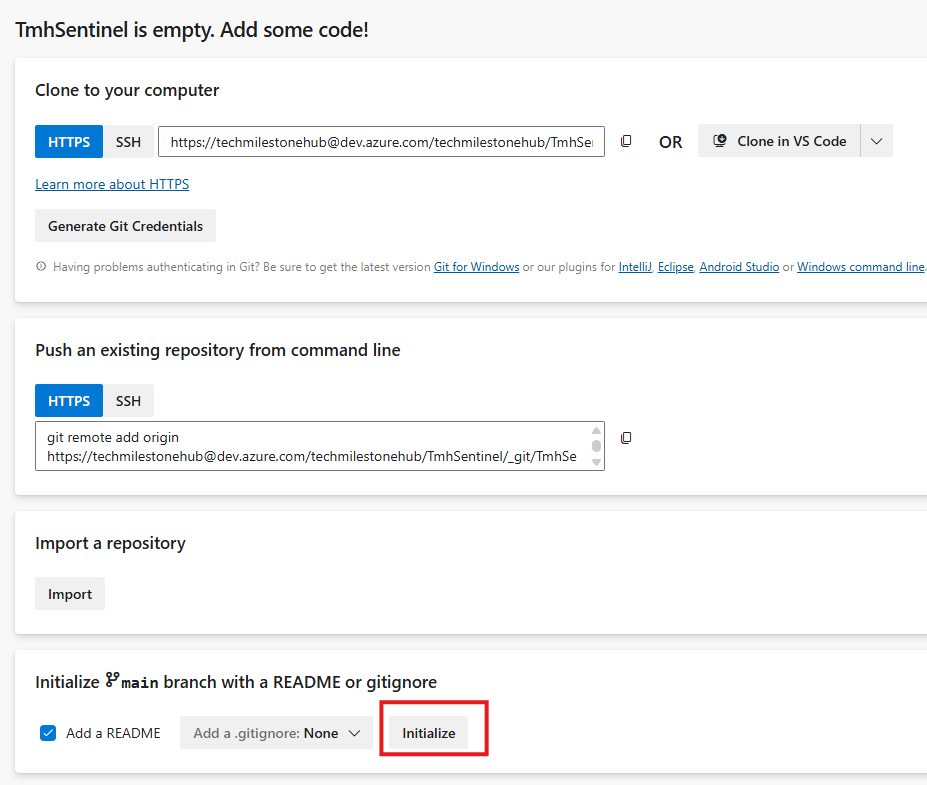
Sentinel > Repositories > Add New
Select Azure DevOps Repository.
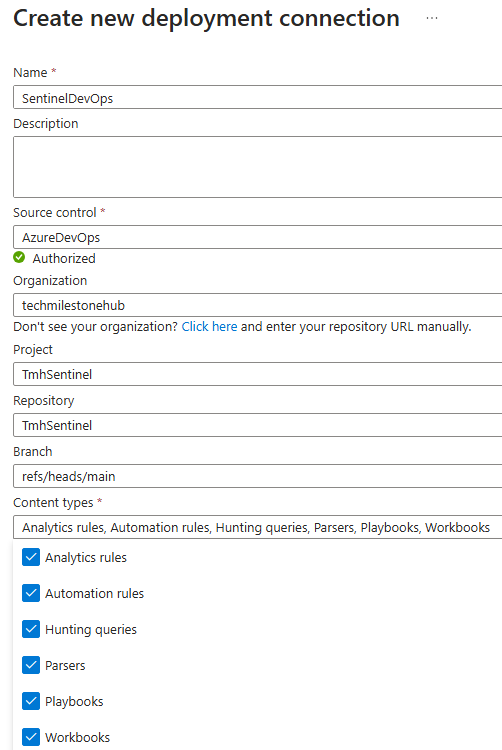
Select everything on the content type.
Click create
Wait for connection to establish
Once connection is established, we can deploy code to the repository.
Create Analytics rule with ARM
Export any analytics rule we created to open in VS code. It will be a JSON file.
We can edit it or create a new one to upload to our repository.
KQL query related to the rule will be found as value to a JSON key called: query
We can upload the file to the branch.
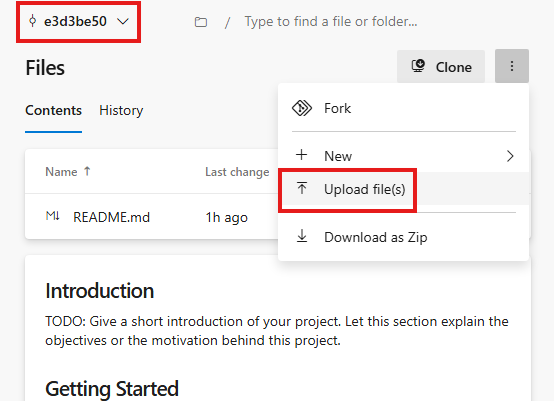
In real life we don’t drag and drop we use CLI for committing
Section Summary
🔐 Microsoft Sentinel with Defender XDR
Defender XDR is a unified portal that brings together all Microsoft Defender products like Defender for Endpoint, Identity, Email, etc.
🧑⚖️ Configure XDR RBAC (Role-Based Access Control)
- You must assign proper roles to users or groups to access Defender XDR.
- ✅ Best Practice: Create a custom RBAC role with required permissions and assign it to a group.
🔗 Connect Sentinel with Defender XDR
- Enable Defender XDR connector in Sentinel for incident sharing.
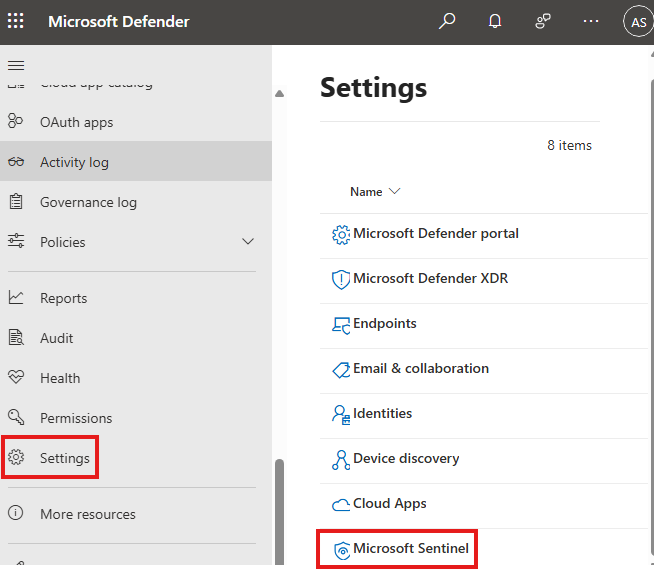
- Install the content solution: Microsoft Defender for XDR.
- This includes analytics rules, queries, and dashboards.
- Go to the Data Connectors blade.
- Open Microsoft Defender XDR connector, then click “Connect incidents & alerts”.
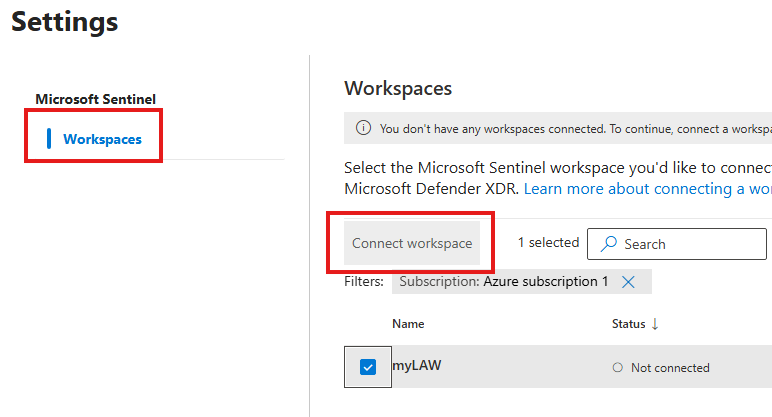
- Select your Log Analytics workspace and finish the connection.
✅ Once connected:
- You’ll see Microsoft Sentinel menus inside the Defender XDR portal (like Azure-style blades).
- Defender XDR incidents and alerts will appear in Sentinel for investigation and automation.
☁️ Microsoft Sentinel with Defender for Cloud
🛡 What Is Defender for Cloud?
Microsoft’s cloud security posture management (CSPM) and cloud workload protection (CWP) service. It checks cloud resources and code repositories for misconfigurations or threats.
🔍 CSPM Plans
- Foundational CSPM: Basic insights and recommendations
- Defender CSPM: Advanced risk insights with attack path analysis
⚙️ CWP Plans (Protect Workloads)
- Defender for Servers
- Defender for App Service
- Defender for Databases
- Defender for Storage
- Defender for Containers
- Defender for Key Vault
- Defender for Resource Manager
- Defender for APIs
By integrating Sentinel with Defender for Cloud, all findings and alerts from Defender can be analyzed, visualized, and automated in Sentinel.
🤖 Microsoft Sentinel with Copilot for Security
Copilot for Security is a generative AI-powered tool designed to assist security teams using natural language.
✨ Key Features
- Incident Summary
Quickly explains what happened in an incident using AI. - Reverse Engineering
Analyzes suspicious scripts or payloads and explains what they do. - Impact Analysis
Evaluates the blast radius of the threat — how far it spread or could spread. - Guided Response
Recommends or guides actions analysts can take to respond effectively.
This integration enhances threat investigation and response using AI, helping both junior and senior security analysts work faster and smarter.
Sentinel With Defender XDR
Unified portal for all defenders.
Configure XDR RBAC
We first need to assign role to access XDR
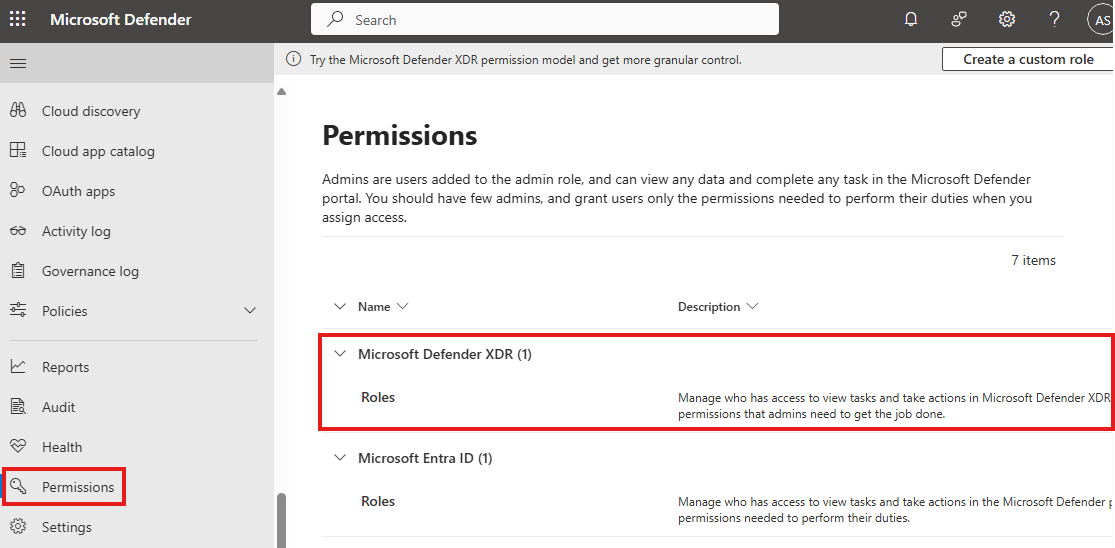
We have to create a custom role and assign to user/group(best practice)
Connect Sentinel with XDR
First we have to Turn on the Defender XDR connector for incidents in Microsoft Sentinel.
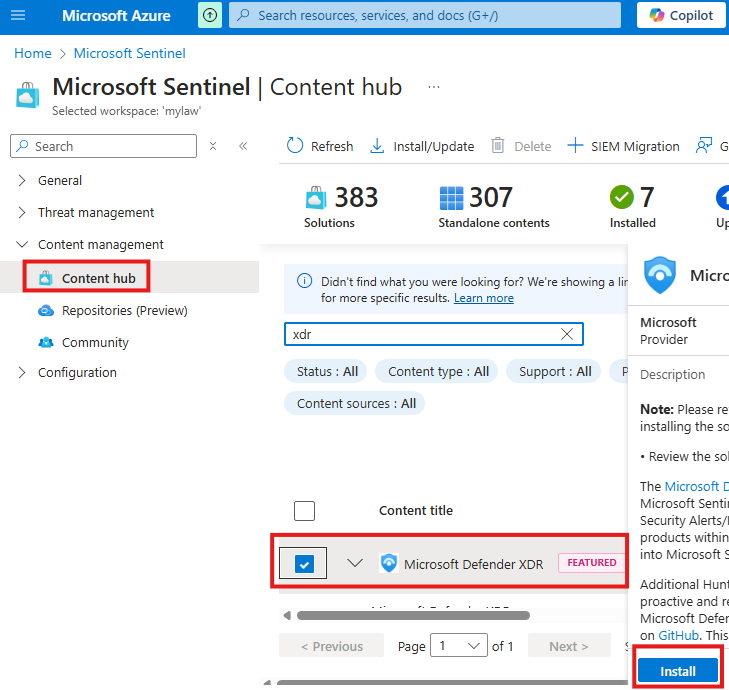
Install the content solution called: Microsoft Defender for XDR
Once solution is installed, it will also install an associated data connector called : Microsoft Defender XDR
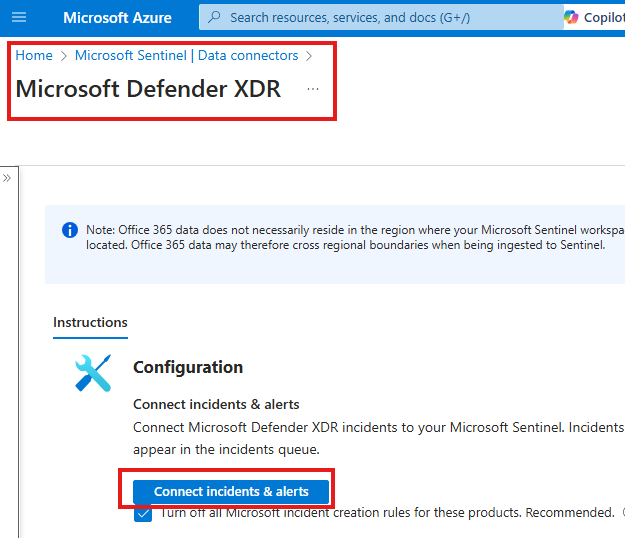
Go to the connecter page of this connector and click: Connect incidents & alerts
Now we can connect Defender XDR to sentinel.
Here select our workspace and connect.
Once connected we can see Sentinel and is menus as blades in defender, like in Azure portal.
Sentinel With Defender For Cloud
Defender For Cloud
Can look for misconfigurations in repositories and in code in repositories.
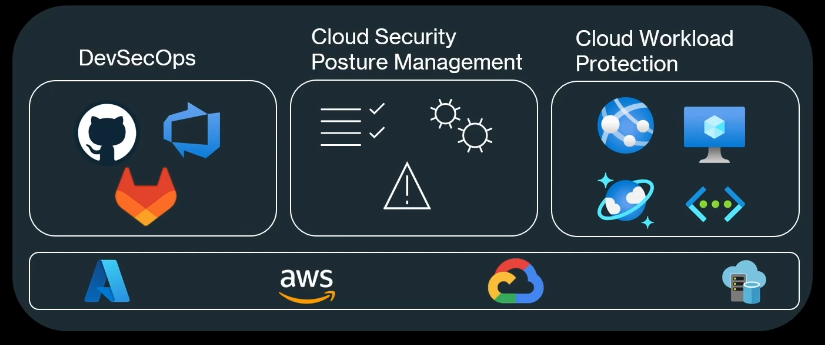
CSPM and CWP
Defender for cloud comes with various CSPM and CWP plans
CSPM
- Foundational CSPM
- Defender CSPM
CWP(Cloud Workload Protection)
- Defender for Servers
- Defender for App Service
- Defender for Databases
- Defender for Storage
- Defender for Containers
- Defender for Key Vault
- Defender for Resource Manager
- Defender for APIs
Sentinel With Microsoft Copilot for Security
Generative AI powered cyber security solution.
1 – Incident Summary
2 – Reverse engineering: Will give info about any malicious scripts.
3 – Impact Analysis
4 – Guided Response
Section Summary
🧾 What is Azure AD B2C?
Azure AD B2C (Business-to-Consumer) allows businesses to manage customer identities. Customers can sign in to your apps using social accounts (like Google, Facebook) or their own email accounts. It’s a separate identity system from your main company directory and is meant for public-facing apps.
- Ideal for apps used by end users (customers)
- Supports external identity providers
- Offers user flows like sign-up, sign-in, profile edit, password reset
🏗️ Setting Up Azure B2C Tenant
Before using Azure AD B2C, you need to:
- Create a special B2C tenant via the Azure Marketplace
- Switch to that tenant using the Azure portal settings
- Access Azure B2C features by selecting your B2C tenant
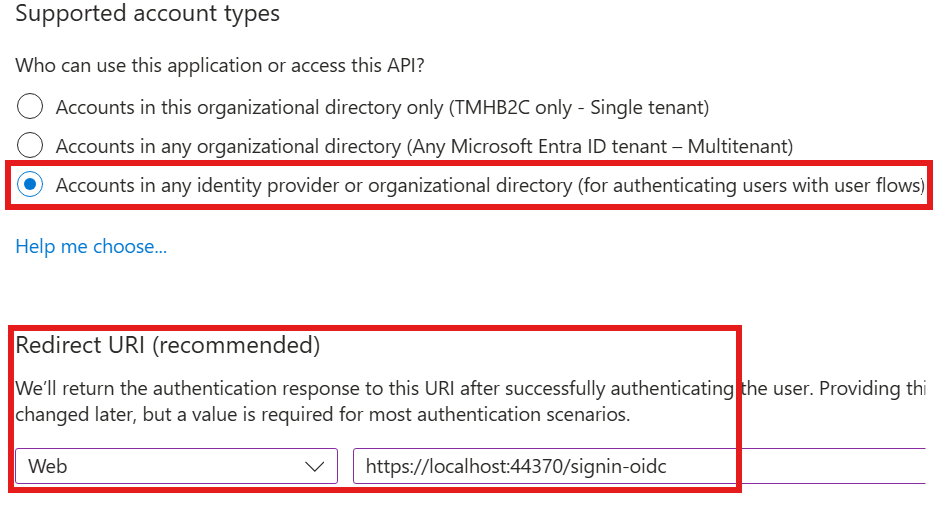
🧩 Registering Applications in Azure B2C
Once your tenant is set up:
- Register your application (e.g., a web or mobile app)
- Enable options for issuing Access tokens and ID tokens
- Add branding, logos, and set a custom domain if needed
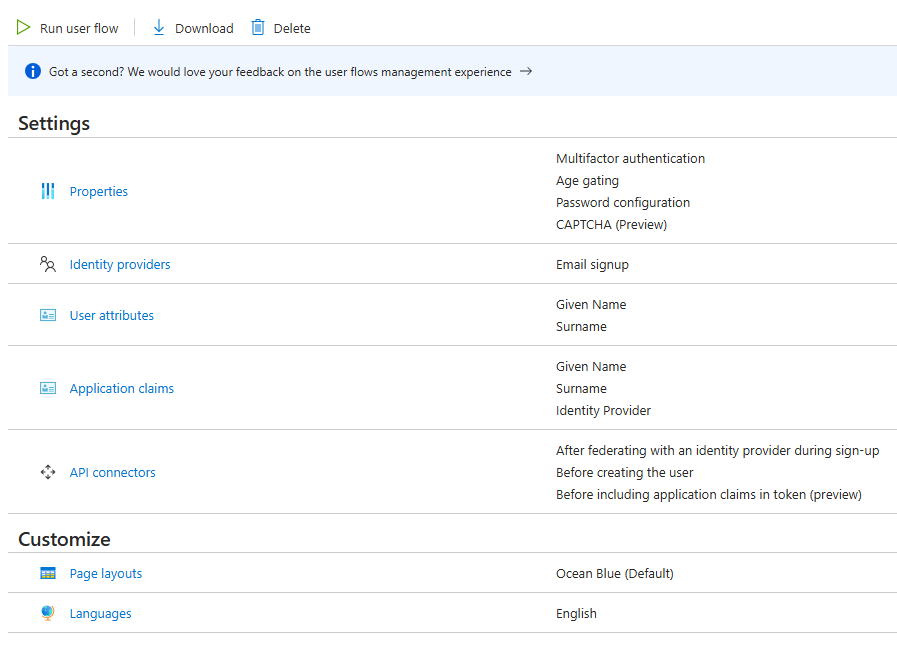
🔄 Creating and Testing User Flows
User flows control how customers interact with your app. You can:
- Create flows for Sign-up and Sign-in
- Set up flows for Profile Editing and Password Reset
- Test these flows directly in the portal to see how registration and login works
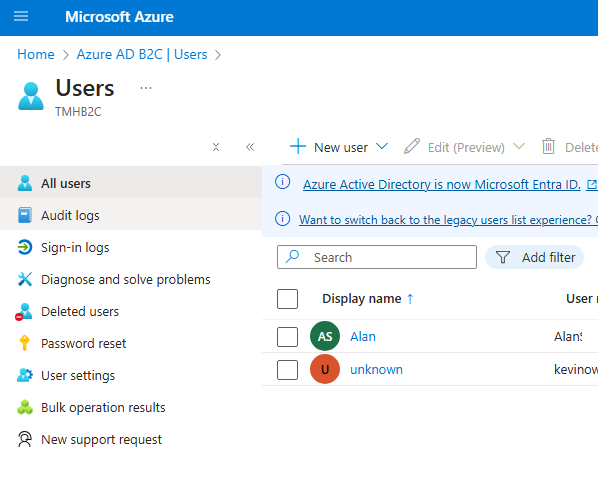
All users who register will appear under the Users section of Azure AD B2C.
🧪 .NET App Integration with Azure B2C
If you’re using a .NET application:
- Add NuGet packages like
Microsoft.Identity.WebandMicrosoft.Identity.Web.UI - Update your
appsettings.jsonwith Azure B2C configuration values (like tenant ID, client ID, instance URL) - Configure authentication using these settings in your startup code
This allows your .NET app to securely sign in users via B2C.
🤝 What is Azure AD B2B?
Azure AD B2B (Business-to-Business) allows you to invite users from another organization to your tenant. This is ideal when:
- You want to give vendors, partners, or collaborators access to your apps or documents (e.g., SharePoint)
- These users maintain their identity in their own organization but can still access your resources securely
⚖️ B2C vs B2B – Key Differences
| Feature | Azure AD B2C | Azure AD B2B |
|---|---|---|
| User Type | External customers | External partners/vendors |
| Identity Managed By | Your B2C tenant | User’s own organization |
| Use Case | Public apps (e.g., shopping, forums) | Internal tools with external access |
| Sign-in Options | Social logins, email, custom login | Azure AD accounts from other orgs |
Azure B2C
Allows business to allow customers to login to their applications. Users can use external identities.
B2B is inviting external users to AD.
B2C is special AD in Azure(Entra) for customers, unlike the users(employees of organization) AD.
B2C AD, is used to manage a different set of Identities.
First we have to create a B2C Tenant.
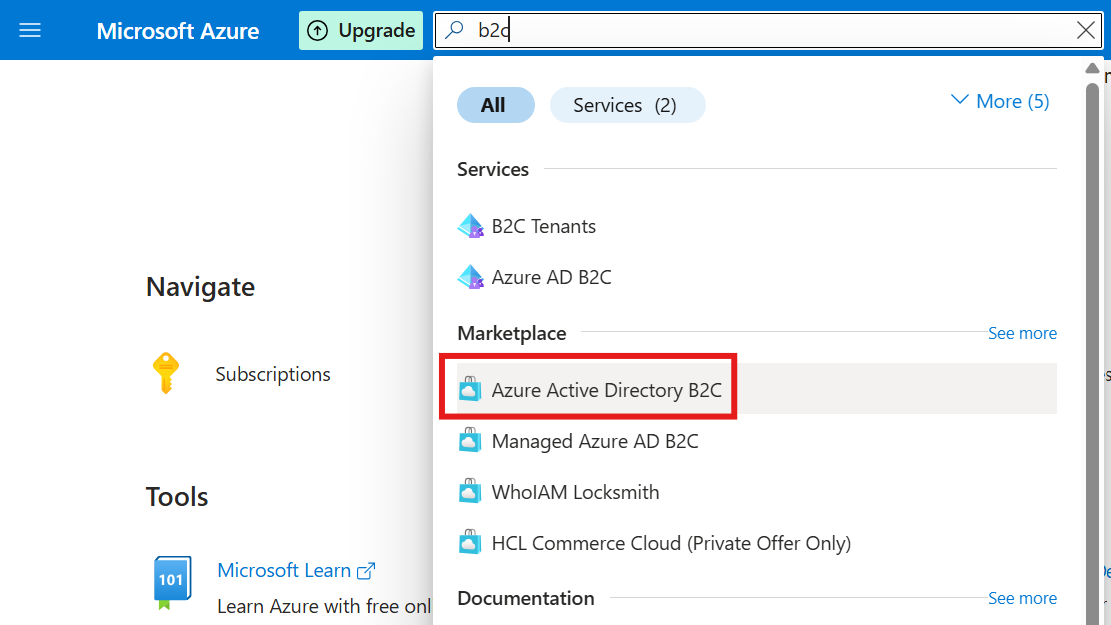
We have to create from market place.
Then, we have to switch tenant to B2C from Settings > Directories + Subscriptions
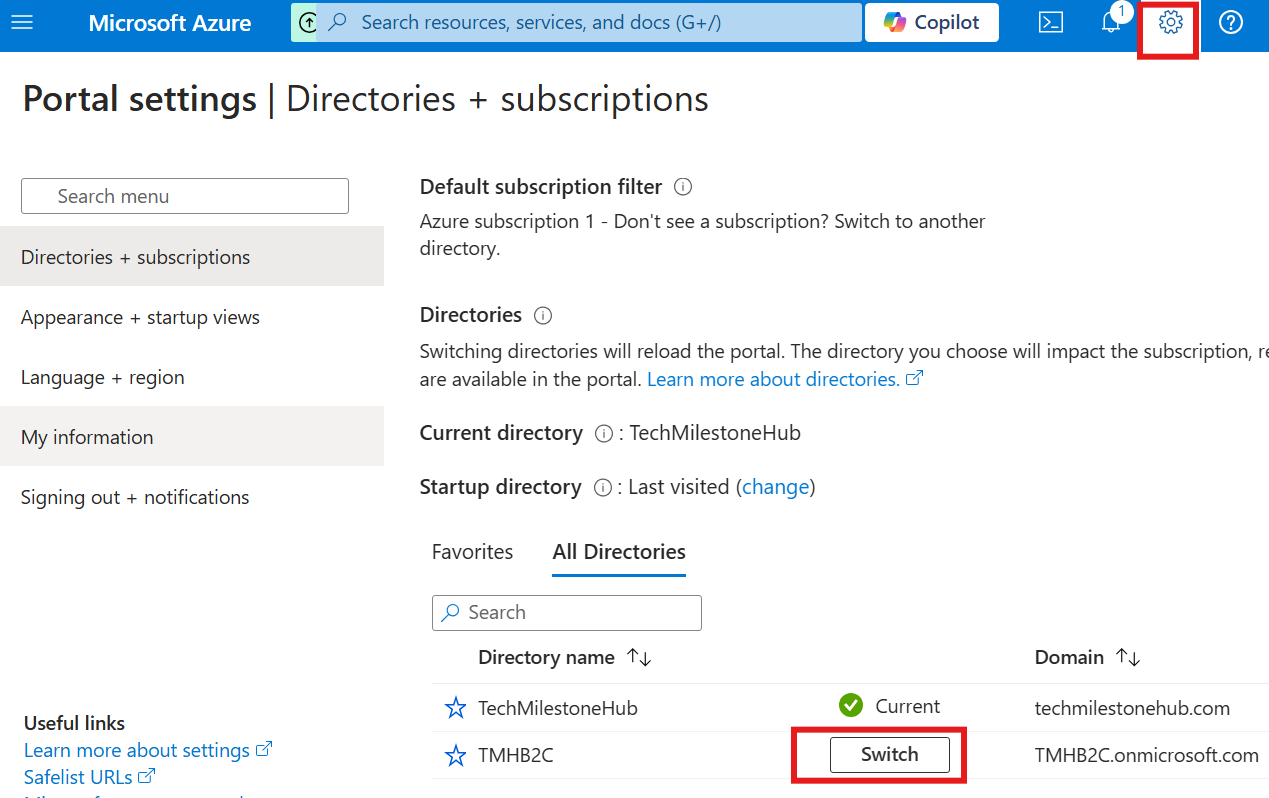
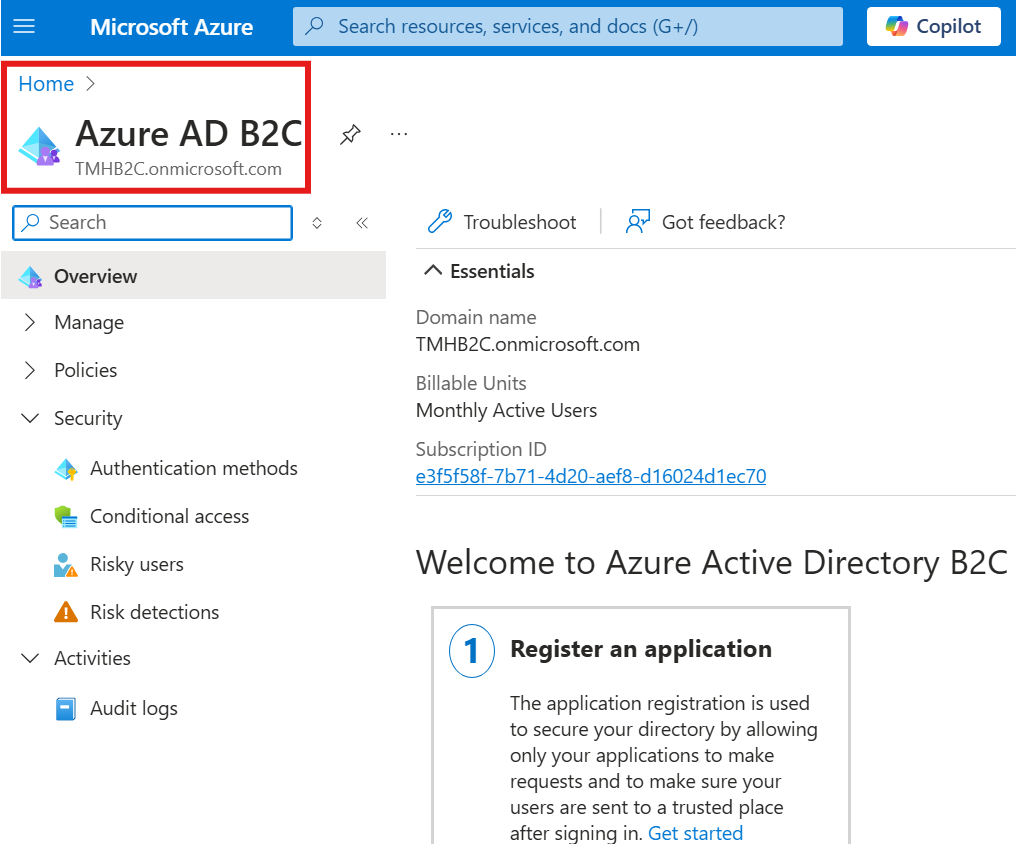
Now, we can go to Azure AD B2C, from Azure portal.
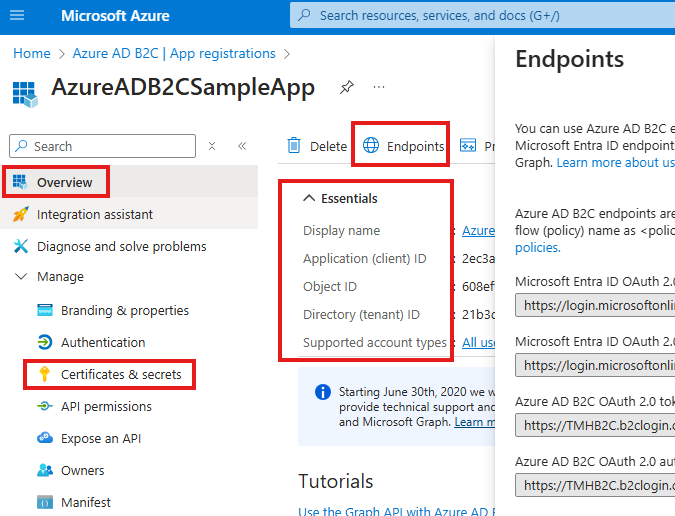
Register Application
Go to Azure B2C AD > Register Application
We can add branding and custom domain in : Branding & Properties
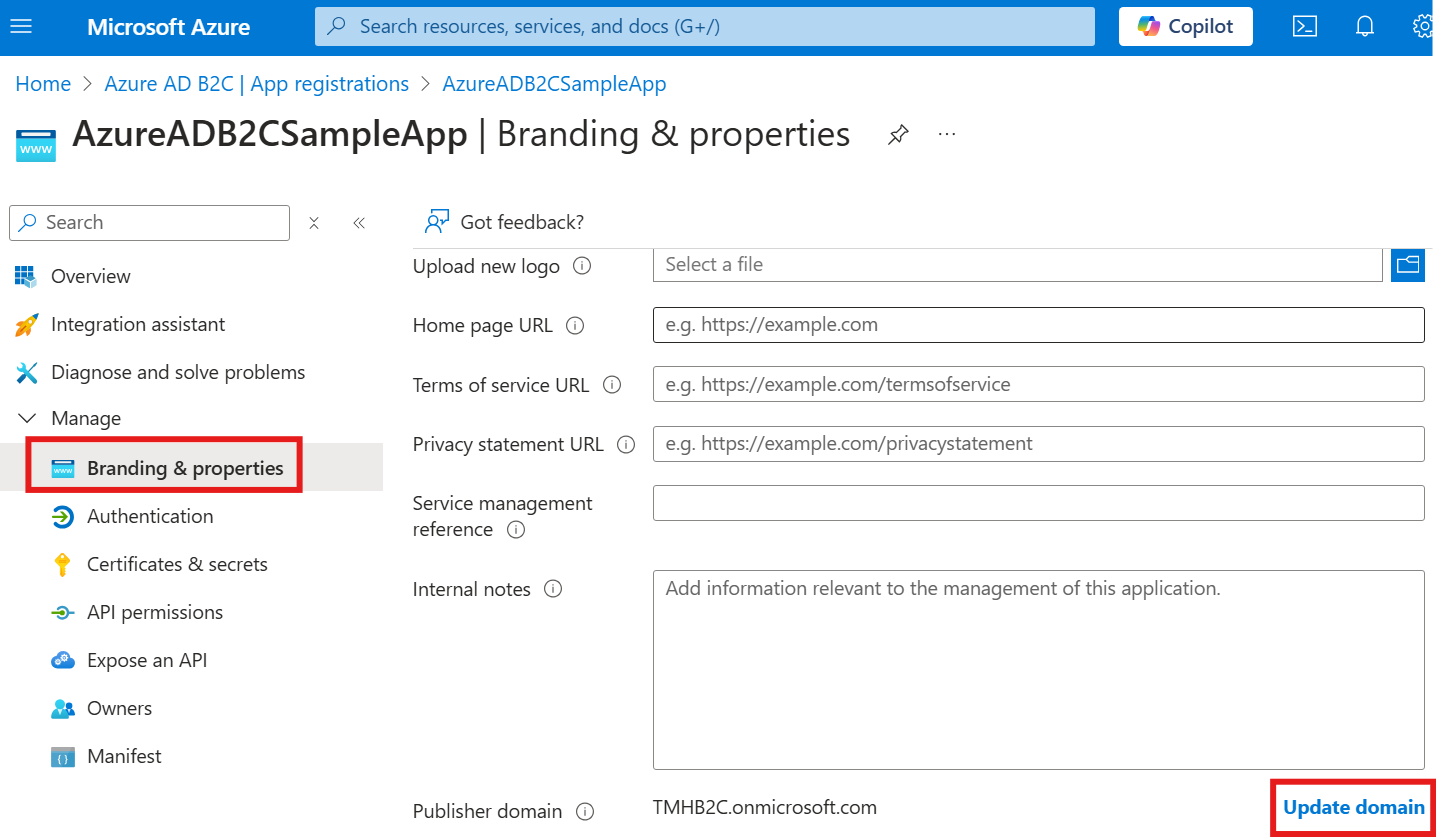
Select the tokens you would like to be issued by the authorization endpoint:
- Access tokens (used for implicit flows)
- ID tokens (used for implicit and hybrid flows)
Create User Flow
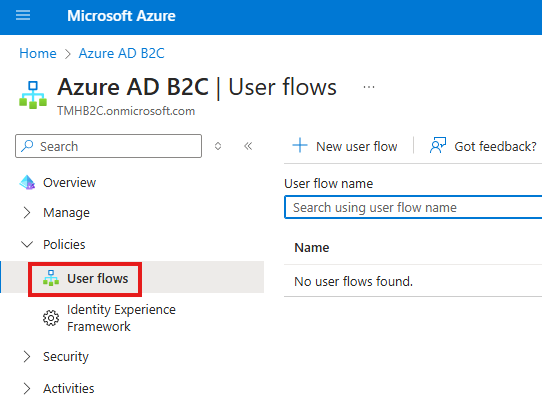
Select User flow for Sign-in and sign-up.
There are other user flows for profile editing, password reset etc.
Once user flow is created, we can run it or edit it.
Crete another user flow for profile editing.
We can test user registration by running the user flows, registered user will show up under Users section
.NET App Configuration
Nugets:
Microsoft.Identity.Web
Microsoft.Identity.Web.Ui
In the appsetting.json file, add AzureB2C configurations
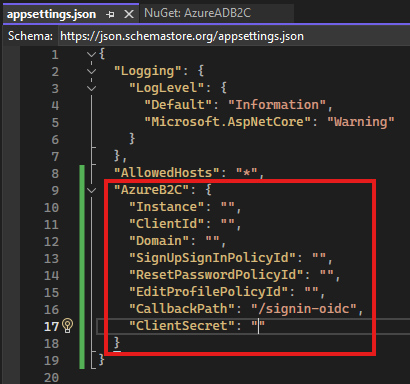
Values for these keys can be found in AzureB2C
Instance: Base URL of endpoints.
to consume configuration in .NET web app:
builder.Services.AddAuthentication(OpenIdConnectDefaults.AuthenticationScheme).AddMicrosoftIdentityWebApi(builder.Configuration.GetSection("AzureB2C"));Create Client secret
Azure B2B
If there is external organization, and we need to give access to these users to resources or SharePoint sites in our organization, we use AzureB2B, to invite external users.
Section Summary
🔍 What is Compliance?
In Azure, compliance means making sure that your cloud resources follow certain standards or rules, which could include:
- Security practices (e.g., VMs must have latest patches)
- Data residency (e.g., data must stay within a specific region)
- Governance and best practices (e.g., tags must be applied to all resources)
These rules help organizations meet regulatory, security, and operational requirements.
🛡️ Azure Policy – Enforcing Compliance
Azure Policy is a service that helps you define and enforce rules (called policies) on your Azure resources.
🏗️ How It Works:
- You define a policy (e.g., “Disallow public IPs on VMs”).
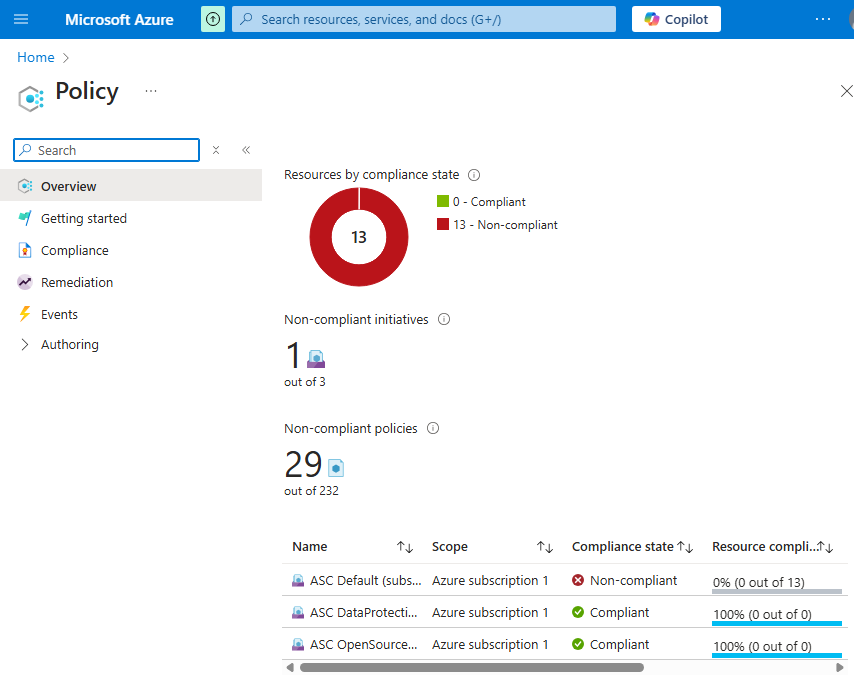
- Azure scans your resources and shows which ones are compliant or not compliant.
- You can take actions to bring non-compliant resources back into compliance.
⚙️ Creating and Viewing Policies
- Go to Azure Policy Service
- From the Azure portal, search and open “Policy”.
- View or Create Policy Definitions
- Click on Definitions to view built-in or custom policies.
- You can filter policies by category (e.g., security, cost, networking).
- Understand the Policy Structure
- Each policy is defined in JSON format.
- Inside, you may find:
"effect": What to do when the rule is triggered (e.g.,audit,deny,deployIfNotExists)."defaultValue": Default behavior (usuallyauditfor testing).
📌 Common Effects in Policies
| Effect | Description |
|---|---|
audit | Logs a warning if a resource violates the policy but allows it to exist |
deny | Prevents resource creation if it violates the policy |
deployIfNotExists | Automatically deploys a required resource or configuration if missing |
For example: If a VM is missing a backup configuration,
deployIfNotExistscan trigger a deployment to fix it.
📈 Why It Matters
- Helps with security, cost control, and resource governance
- Supports industry standards like ISO, NIST, HIPAA, etc.
- Enables automated remediation of non-compliant resources
Compliances
Certain standards that resources in Azure must follow, like VM should have latest security patches etc.
Data should be stored in a particular region.
Azure Policy Service
We can define policies here and if any resources are not compliant with the policies, it will show not compliant.
To create a new policy go to definitions:
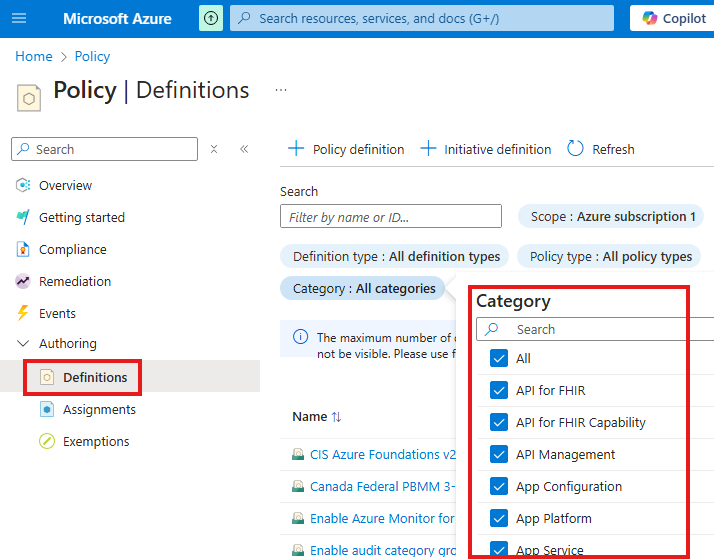
There are many categories available. We can filter by categories.
If you open a policy, we can see it is defined in JSON.
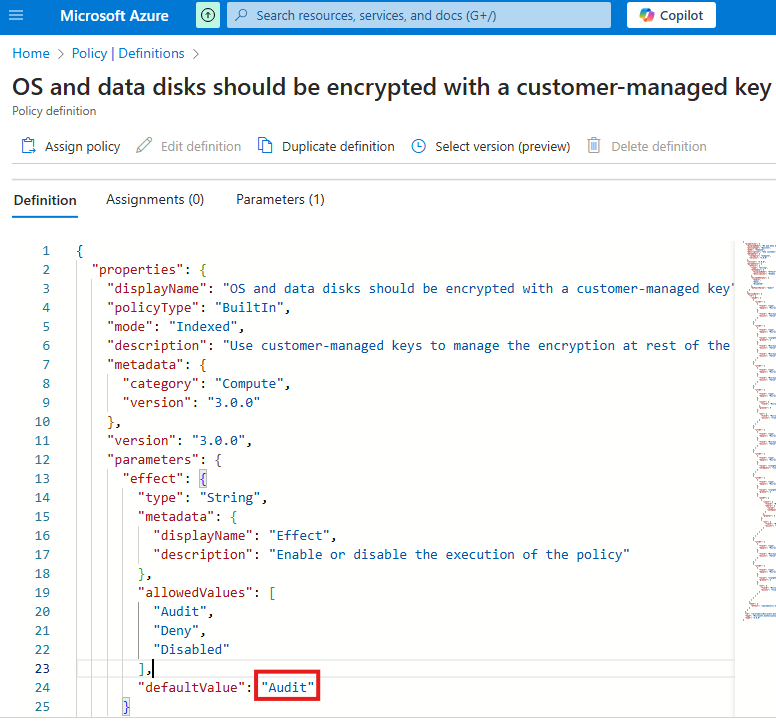
defaultValue will be Audit. For some policies it will be remediation, in that case we have to make changes to make it align with policy.
effect deployIfNotExist, means policy will take effect if not there.